Geremy Carnes (Lindenwood University) and Margaret K. Smith (Southern Illinois University Edwardsville)
Written for the Cleveland Teaching Collaborative
Digital tools and methods can offer powerful outcomes in the humanities classroom. Integrating digital humanities into existing curricula offers students new points of entry into the humanities and gives them new tools for interrogating sources, evaluating evidence, and forming arguments. DH also invites students to apply a humanistic eye to the world of technology that they’re immersed in, to use those same skills to understand and interact with the digital world in a more informed and ethical way.
DH pedagogies offer students the opportunity to engage with humanistic questions and sources through new lenses, think critically about how arguments and information are mediated by technology, and build digital literacies. However, access to DH resources is unevenly distributed. Perennial challenges of funding, access to hardware and software, and access to training in digital tools and methods have been exacerbated by pandemic conditions.
This showcase highlights some tools, methods, and resources that minimize those barriers: they’re free, relatively quick and easy to learn and teach, and you can implement them in the classroom in a variety of ways
Method: Text Analysis
Text analysis is one of the oldest forms of humanistic practice, but new digital tools can perform text analyses on a scale that would be impossible for a human being to achieve. These computationally-enabled forms of text analysis cannot replace traditional forms of practice, but they can complement them, revealing patterns across a single text or across vast corpora of texts that lead to new insights.
Spotlight Tool: NGram
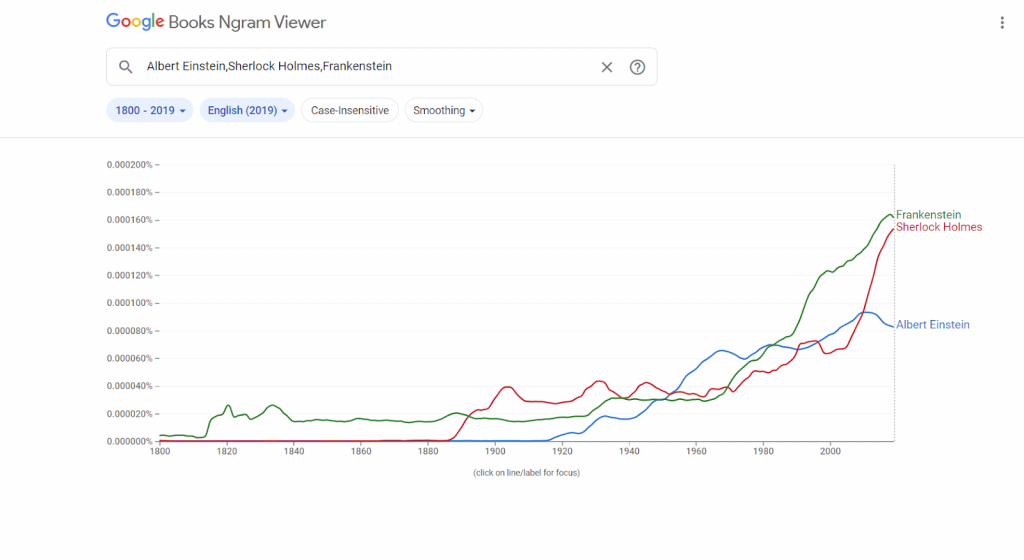
One of the simplest yet most powerful ways to get started with computationally-enabled text analysis is with the Google NGram Viewer. The NGram Viewer is a free tool that allows you to plot the usage of particular words over time, across over 8 million books and 5 centuries. The sheer size of its corpus makes the NGram Viewer the best way to quickly explore language change over time in the classroom.
Learning Outcomes
Using the Google NGram Viewer can be a component of many traditional text analysis assignments. It can also be used by itself in low-stakes exploratory assignments. Assignments involving the NGram Viewer support outcomes for many types of courses, especially literature and history courses:
- Students reflect on the processes of language change through consideration of statistically-based visual evidence.
- Students examine the relationship between language change and historical developments/events.
- Students support their analysis of a text with evidence about historical word usage frequency.
Resources
To get started with the Google NGram Viewer, simply go to https://books.google.com/ngrams and start searching. Enter the words you want to graph (separated by commas) and the date range you want to examine, and the NGram Viewer will graph those words’ frequency within Google’s corpus over that time period. If you spend a half hour reading the help documentation, more advance searches and graphs become possible, such as searching for words used as a particular part of speech or adding the results for multiple words together in a single graph line.
The NGram Viewer does have some limitations you should be mindful of. The OCR (Optical Character Recognition) used to build Google’s corpus isn’t perfect, especially with texts from earlier centuries. (When running searches prior to 1800, be mindful of the fact that many long S’s have been recorded as F’s.) There are also valid concerns about the representativeness of the corpus’s contents. However, while these limitations are important to keep in mind when using the NGram Viewer to make scholarly arguments, they are unlikely to present a problem for classroom usage; indeed, discussing these limitations can help students think more critically about the nature of text analysis corpora.
For an example of the kind of creative assignment to which Google NGram lends itself well, check out how Katherine D. Harris had her students use the tool in an exploratory manner when reading A Clockwork Orange.
Other Free and Accessible Text Analysis Tools:
- Voyant, https://voyant-tools.org/: identify and analyze themes, topics, and patterns internal to a text or corpus
Method: Digital Storytelling
Scholars in the humanities know that narratives are powerful. We spend much of our work in the classroom guiding students in examining, interrogating, and dissecting narratives. Yet outside of courses with an explicit “creative” or “application” focus like creative writing, it’s uncommon for students to spend much time developing narratives in their coursework. This general absence in course curricula is a major missed opportunity, as one of the best ways to help students grasp how narratives work—whether as literary artifacts or as historical or social constructs—is to have them create one.
Spotlight Tool: Twine
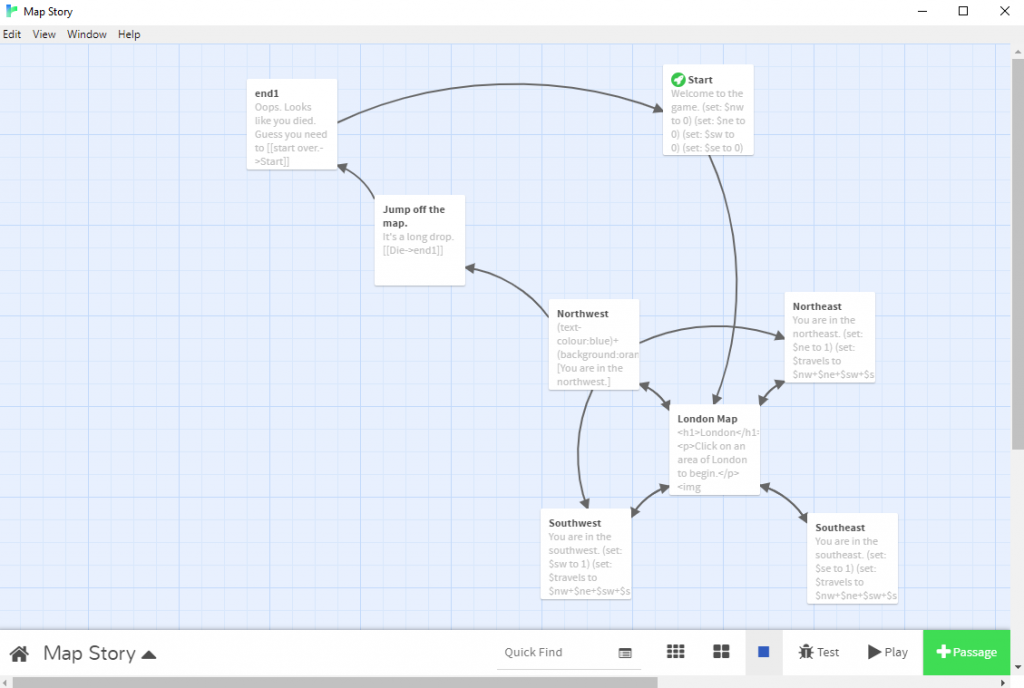
The ways in which instructors can introduce narrative-based assignments into their courses are numerous, but one particularly valuable way to do so is via Twine. Twine is a free online tool for creating interactive narratives and games that can be run in any commonly used web browser. A basic Twine game consists of a number of “passages” (i.e., pages of the story) connected to each other by links. Any passage with links to more than one other passage will introduce a branch in the narrative. A passage can link to any other passage in the story, so it is also possible for branches in the narrative to rejoin. Each branch eventually arrives at an ending (the nature of which depends on the kind of story you are telling). The result is something akin to a Choose-Your-Own-Adventure book in digital form. While the tool has the depth to create quite sophisticated and technically complex games, its most basic feature—the ability to create branching-path narratives—can be learned in a few minutes with no prior experience with markup languages or coding.
Learning Outcomes
Assigning students to create a narrative in Twine based on their coursework provides valuable learning experiences that would support learning outcomes in many upper-level courses in the humanities:
- Students draw upon their knowledge of course material to design and author an original work. (Creation is at the pinnacle of the Revised Bloom’s Taxonomy.)
- Students reflect on historical contingency and processes of ethical decision-making. (The branching nature of Twine games draws students’ attention to moments of ethical uncertainty and historical possibility.)
- Students gain basic experience in web design and digital literacy, fundamental skills that belong in all twenty-first-century humanities curricula. (If a course wants to support more advanced digital skills, an assignment can require usage of some of the more complex Twine features, such as CSS, variables, and scripting.)
Depending on the nature of the assignment, the project can also support developing research or collaboration skills.
Resources
The program is simple to download and install from www.twinery.org. In fact, installation isn’t even necessary in most cases. Twine games can be created entirely in the web browser on the Twinery site. Twine’s “help” site, the Twine Cookbook, contains detailed information on how to use Twine’s many features, and when you run into trouble, the Twine community on Reddit can help you out. Numerous Twine tutorials are also available on Youtube. But to get started, you only need to read two pages in the Twine Cookbook: First Story and Passages. Those pages (about fifteen minutes of reading) contain everything you need to know to write a basic branching narrative on Twine. Take half a class session to walk students through these materials in a computer lab, then let them have the second half to experiment with the tool. Students will leave sufficiently prepared to develop a Twine story on their own.
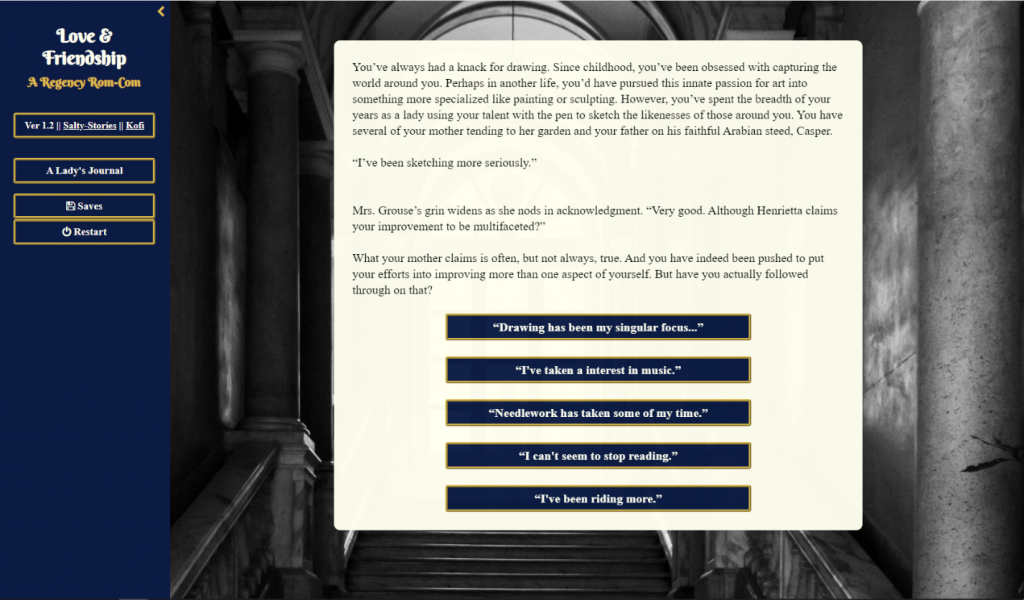
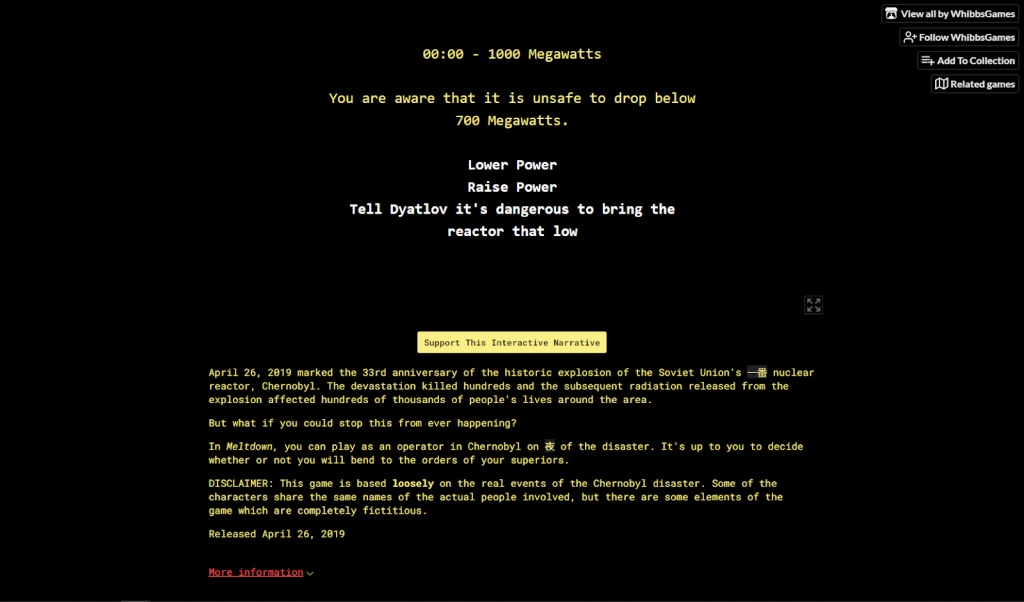
How you employ Twine in your course will depend on the course’s nature and learning objectives, but there are valuable example assignments available online, such as Sarah Einstein and Matthew Vetter’s social-issue-based game assignment for a gender-studies course, or Jeremiah McCall’s assignment for a short, historically authentic interactive story in a history course (complete with a sample grading rubric).
Other Free and Accessible Digital Storytelling Tools:
- Juncture, https://juncture-digital.org/: illustrate written essays with linked multimedia content like images and maps
- TimelineJS, https://timeline.knightlab.com/: create historical narratives in the form of timelines with linked multimedia content
Method: Digital Annotation
Analog annotation assignments are standard fare for humanities courses. They ask one thing of a student: curiosity. Annotation assignments can help students identify the familiar and confront the other. Students highlight not only what they might think is “significant” according to perceived scholarly standards, but what they find funny, out of place, interesting, or just plain weird. In addition, annotation assignments reduce barriers to classroom participation, providing a handy resource when conversation stalls or when fears inhibit participation. Annotation assignments thus draw the students into the text and into the classroom. Digital annotation assignments translate these outcomes into virtual formats, but they also offer benefits of their own, deepening student engagement with sources and sharpening humanities skills. Digital annotation tools require students to attach their observations to specific locations on the document, a process that clarifies the direct links between evidence and argument and distinguish between observations and inferences. They also facilitate collaborative annotation, so that students can see, build on, and nuance each other’s observations and inferences.
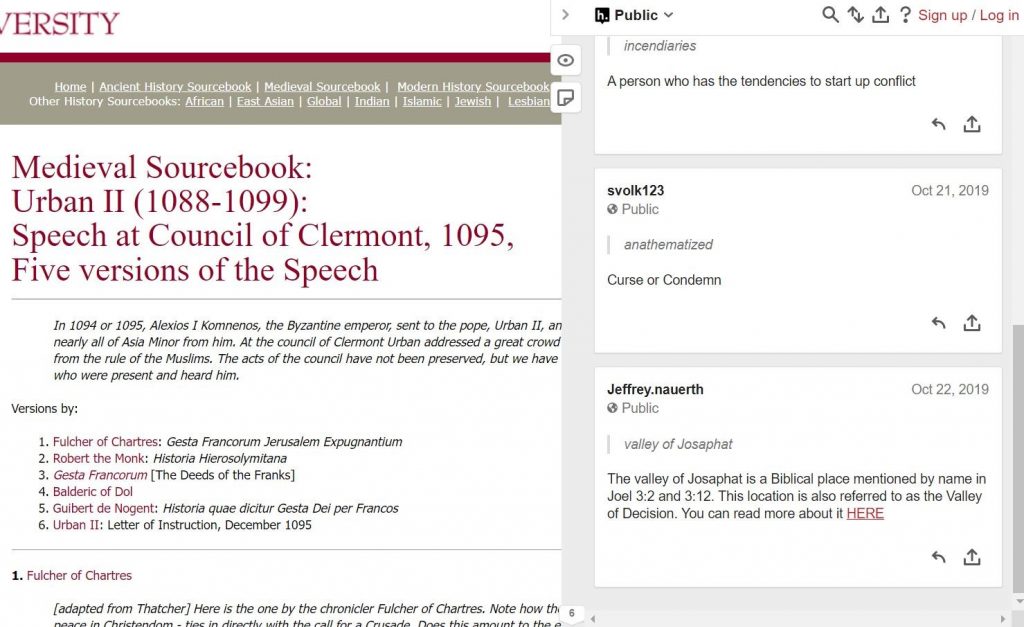
Spotlight Tool: Hypothesis
Hypothesis is a web annotation tool that allows students to annotate web pages and uploaded documents, both individually and collaboratively. With the Hypothesis sidebar, students (and teachers) can highlight text, add text annotations, and respond to others’ comments. While Hypothesis is piloting a version that can be embedded into an LMS, you can also use it as a Chrome extension, WordPress plugin, or a simple browser bookmark. All versions offer the same core functionality: an intuitive web interface that facilitates social annotation across a wide variety of document formats and genres.
Learning Outcomes
Annotating texts deepens student engagement with sources, with course content, and with each other.
- Through collaborative or social annotation, students will gain experience synthesizing and conveying their ideas.
- Students will be able to distinguish between observation and inference and support arguments with evidence with primary sources.
- Students will develop skills for active and engaged reading, improving comprehension and analysis.
Resources
Setting up Hypothesis for classroom use is simple and relatively quick and comes with several options:
- If students have access to computers and permissions to install browser plugins, they can set up the Hypothesis Chrome extension.
- If not (or if you don’t want to assume that’s the case), you can also set up bookmarklets that allow Hypothesis to work in any browser without any extra steps.
- If your institution uses an LMS and has multiple instructors using Hypothesis, it might also be worth exploring an LMS integration.
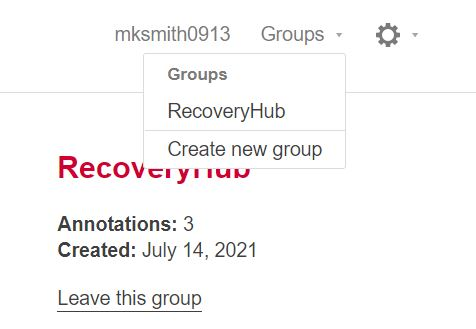
As the instructor, your first step is to create a private group for the course. One of Hypothesis’s essential attributes for pedagogical purposes is the ability to control the visibility of your students’ annotations. By creating a private group, you can ensure that your students’ annotations are visible to each other but not to the general public. Students can quickly create an account with just an email address, username, and password. Once their account is live, they can join the group via an invitation link.
Over the semester, they can annotate virtually any web content through a simple sidebar interface. They can interact with each other on the same document, or they can go to the group page and see classmates’ annotations on other websites. This interface allows them to make connections within and across course materials and connect those materials to, for example, news articles, book reviews, or blog posts.
Here are a few examples of what a Hypothesis assignment might look like:
- Source annotation: Students can collaboratively annotate primary sources, either as preparation for an in-person course or as an asynchronous alternative. Those primary sources might be available on existing websites (e.g. Project Gutenberg or the Internet History Source Book), or they might be documents you’ve uploaded to a course website.
- Course content in the wild: Students might look for references to key concepts, course themes, or specific texts outside the classroom. When they annotate the content, both the annotation and a link to the context appear on the group page, allowing the instructor and classmates to see and engage. (I especially like this one as an extra credit assignment!)
- Collaborative study guides: In addition to the group interface, Hypothesis also allows you to tag annotations. With this functionality, students can collaboratively assemble definitions of key concepts, examples of those concepts in application, and other core knowledge. Although we usually think of study guides as exam prep, they’re also nice end-of-semester reflections for courses without exams and help students place course materials in a broader narrative.
- Peer review: As students work on papers or projects, Hypothesis also allows for them to peer review and constructively critique each others’ work.
Find other examples and use cases on the Hypothesis website.
Other Free and Accessible Digital Annotation Tools
- Perusall, https://perusall.com/: annotate uploaded or imported sources (in a variety of formats) and respond to other students’ annotations
- Recogito, https://recogito.pelagios.org/: annotate and tag images and maps
Mapping and Data Visualization
While mapping and data visualization require substantially more scaffolding than some tools on this list, the payoffs are significant. Introducing students to historical data sets gives them crucial insights into just how messy data is, even when it’s presented in a neat and attractive graph. It also helps them understand how to navigate that messy data, identify patterns, and make connections between the numbers on the page and the human lives they represent.
Spotlight Tool: StoryMapJS
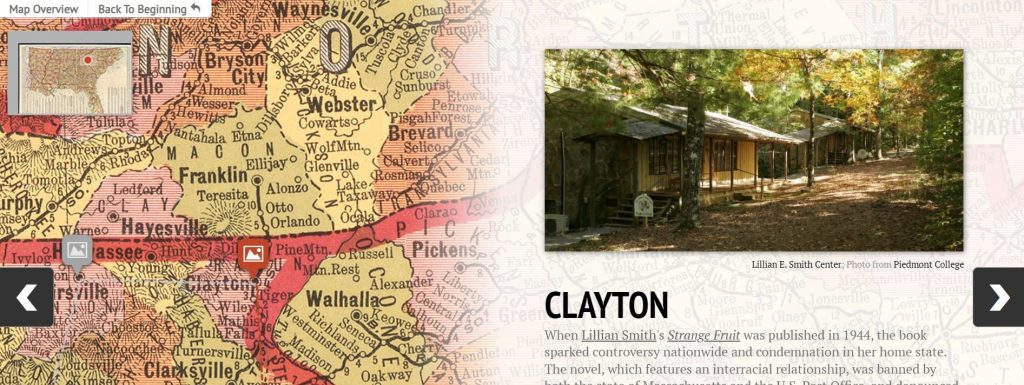
StoryMapJS, one of a suite of tools developed by Northwestern’s Knight Lab, is an easy-to-use tool for digital storytelling using spatial data. Using a web interface, students can create storytelling exhibits that move their audience through a series of points on the map, each including media, captions, and extended narrative. The resulting map can be embedded on almost any website. It’s a simple but powerful entry point for students to think about how data and narrative mutually inform one another.
Learning Outcomes
Mapping and data visualization give students the tools to interrogate received arguments and to use evidence to construct their own.
- Students will learn how to extract and encode data from historical and literary sources.
- Students will consider the relationship between data and human experiences.
- Students will learn how to create interactive maps that combine spatial data with humanistic context.
Resources
Getting started with StoryMapJS requires only a Google account. Students can use their own, or the instructor can set up an account for the class. (If students are working in groups, they’ll need to have a single login, and in those cases an ad hoc account is a must to avoid sharing personal passwords.)
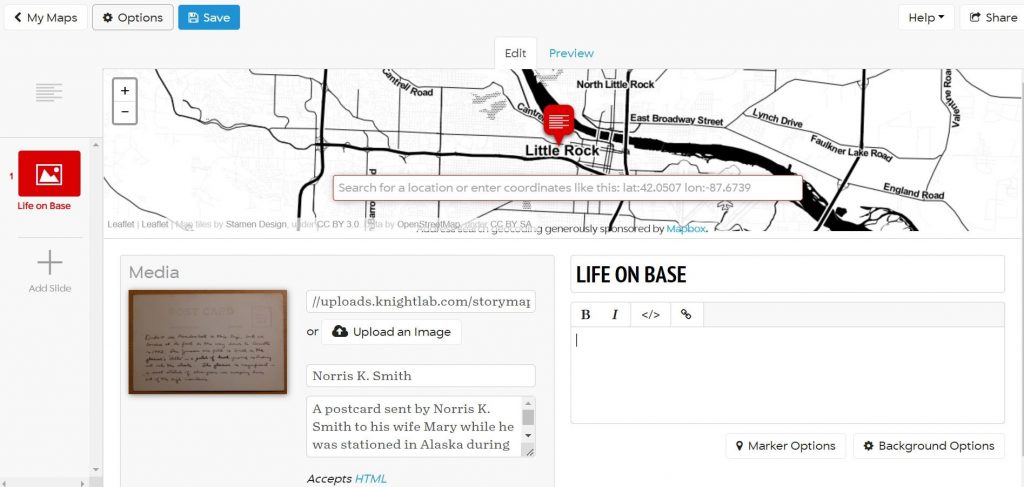
The editing interface is fairly intuitive, and the Knight Lab provides a robust set of resources in its help section. The interface is structured around slides, and each slide contains a map point, a piece of media and its caption, and some descriptive text.
Once the map is finished, it can be embedded as an iframe on a course website or any of the free site creators (e.g. Wix or Weebly).
The Knight Lab also provides a gallery of example maps that demonstrate the breadth of content and narrative style possible.
- Arya’s Journey: This map uses a base map of the world of Game of Thrones to follow the journey of Arya Stark.
- Midwest Time Machine: This map allows the viewer to follow one of four historical figures through a specific era in Chicago’s past.
- Southern Literary Trail: This map also links text and place, taking viewers on a journey across the South through places that have influenced the works of writers like Alice Walker, Truman Capote, and Flannery O’Connor.
Here are a few sample assignments to scaffold the construction of a story map:
- Thinking narratively: Kimberly Hellerich’s digital storytelling assignment engages students with the elements of narrative and with the relationship between medium and message. These foundations help them think through the perspectives and experiences of both the storyteller (themselves) and their audience.
- Dealing with data: To build a story map, students will need a data set – some set of coordinates related to a common theme or narrative. While they could use an existing data set, creating their own can help bring data literacy issues to life and demonstrate just how many choices go into a data set. How precisely can you or should you be about geolocation? (For instance, if you’ve got a slide about Chicago, do you drop your pin in the center? Downtown? At a specific address?) How many slides do you need to tell this story with nuance, but without bogging down your reader? Whose perspective should you tell the story from? (For instance, in creating a story map about Native American history, do you use indigenous or English names for places?)
An easy way to get students thinking through these and other questions is to have them encode data from a particular text. The text can be anything (historical, literary, contemporary commentary), so long as it’s got a sense of place(s). They decide what moments and what places best capture the essential narrative, and they practice contextualizing that narrative through the descriptive text and illustrative media.
- Create a StoryMap: Once they’ve got a data set (one they created or one they found), creating the map is a comparatively simple task. But in creating the map, they also have decisions to make about style and presentation. During this phase, they should think through their audience – who are they, and what kinds of material would they find most engaging.
- Each of these assignments and phases also provides ample opportunity for reflective writing about what decisions they’re making and how they’re doing so.
Other Free and Accessible Mapping and Data Viz Tools
- StorylineJS, https://storyline.knightlab.com/, and TimelineJS, https://timeline.knightlab.com/: two other tools from the Knight Lab that contextualize chronological data points through annotation and digital storytelling respectively
- Tableau Public, https://public.tableau.com/en-us/s/: create visualizations with your own data sets