Contributed by Margaret Smith, Southern Illinois University Edwardsville
Written for the Cleveland Teaching Collaborative
While mapping and data visualization require substantially more scaffolding than some tools on this list, the payoffs are significant. Introducing students to historical data sets gives them crucial insights into just how messy data is, even when it’s presented in a neat and attractive graph. It also helps them understand how to navigate that messy data, identify patterns, and make connections between the numbers on the page and the human lives they represent.
Spotlight Tool: StoryMapJS
StoryMapJS, one of a suite of tools developed by Northwestern’s Knight Lab, is an easy-to-use tool for digital storytelling using spatial data. Using a web interface, students can create storytelling exhibits that move their audience through a series of points on the map, each including media, captions, and extended narrative. The resulting map can be embedded on almost any website. It’s a simple but powerful entry point for students to think about how data and narrative mutually inform one another.
Learning Outcomes
Mapping and data visualization give students the tools to interrogate received arguments and to use evidence to construct their own.
- Students will learn how to extract and encode data from historical and literary sources.
- Students will consider the relationship between data and human experiences.
- Students will learn how to create interactive maps that combine spatial data with humanistic context.
Resources
Getting started with StoryMapJS requires only a Google account. Students can use their own, or the instructor can set up an account for the class. (If students are working in groups, they’ll need to have a single login, and in those cases an ad hoc account is a must to avoid sharing personal passwords.)
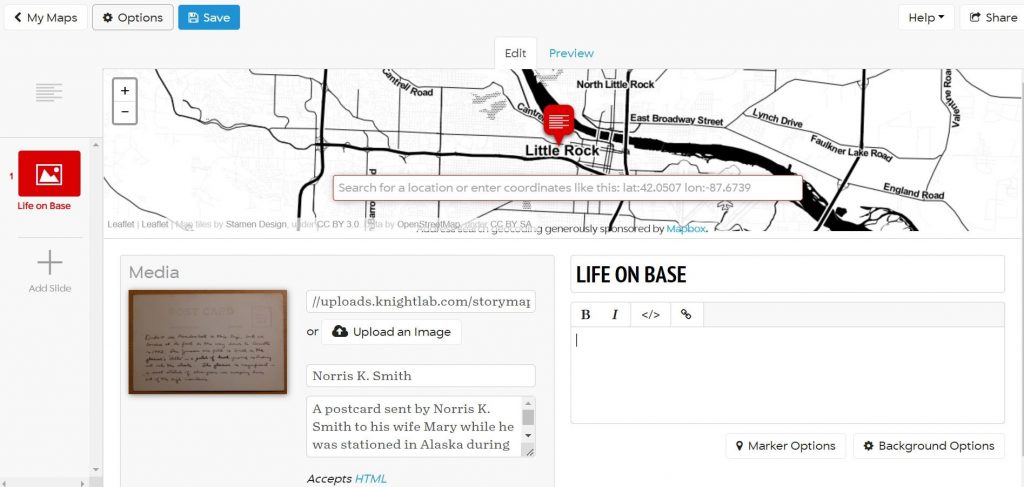
The editing interface is fairly intuitive, and the Knight Lab provides a robust set of resources in its help section. The interface is structured around slides, and each slide contains a map point, a piece of media and its caption, and some descriptive text.
Once the map is finished, it can be embedded as an iframe on a course website or any of the free site creators (e.g. Wix or Weebly).
The Knight Lab also provides a gallery of example maps that demonstrate the breadth of content and narrative style possible.
- Arya’s Journey: This map uses a base map of the world of Game of Thrones to follow the journey of Arya Stark.
- Midwest Time Machine: This map allows the viewer to follow one of four historical figures through a specific era in Chicago’s past.
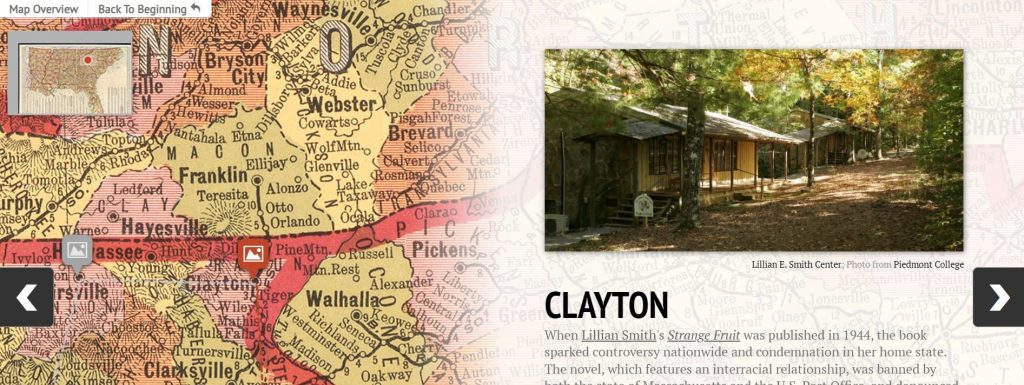
- Southern Literary Trail: This map also links text and place, taking viewers on a journey across the South through places that have influenced the works of writers like Alice Walker, Truman Capote, and Flannery O’Connor.
Here are a few sample assignments to scaffold the construction of a story map:
- Thinking narratively: Kimberly Hellerich’s digital storytelling assignment engages students with the elements of narrative and with the relationship between medium and message. These foundations help them think through the perspectives and experiences of both the storyteller (themselves) and their audience.
- Dealing with data: To build a story map, students will need a data set – some set of coordinates related to a common theme or narrative. While they could use an existing data set, creating their own can help bring data literacy issues to life and demonstrate just how many choices go into a data set. How precisely can you or should you be about geolocation? (For instance, if you’ve got a slide about Chicago, do you drop your pin in the center? Downtown? At a specific address?) How many slides do you need to tell this story with nuance, but without bogging down your reader? Whose perspective should you tell the story from? (For instance, in creating a story map about Native American history, do you use indigenous or English names for places?)
An easy way to get students thinking through these and other questions is to have them encode data from a particular text. The text can be anything (historical, literary, contemporary commentary), so long as it’s got a sense of place(s). They decide what moments and what places best capture the essential narrative, and they practice contextualizing that narrative through the descriptive text and illustrative media.
- Create a StoryMap: Once they’ve got a data set (one they created or one they found), creating the map is a comparatively simple task. But in creating the map, they also have decisions to make about style and presentation. During this phase, they should think through their audience – who are they, and what kinds of material would they find most engaging.
- Each of these assignments and phases also provides ample opportunity for reflective writing about what decisions they’re making and how they’re doing so.
Other Free and Accessible Mapping and Data Viz Tools
- StorylineJS, https://storyline.knightlab.com/, and TimelineJS, https://timeline.knightlab.com/: two other tools from the Knight Lab that contextualize chronological data points through annotation and digital storytelling respectively
- Tableau Public, https://public.tableau.com/en-us/s/: create visualizations with your own data sets