Scrollytelling is a form of interactive storytelling that pairs text with media. As you scroll through the narrative, the media automatically transforms. Media might include video, images, and clickable maps.
These can be really complex! Here are some fancy examples of scrollytelling that highlight how interactive scrolling can engage the reader.
But they don’t have to be complicated to be effective. The key to good scrollytelling is to think about how your text and media enhance one another. The media isn’t just illustrating the text – it’s adding meaning that the text can’t convey effectively or completely on its own.
This tutorial comes from the IRIS Center at SIUE and was written by Dr. Meg Smith. For the most up-to-date instructions, see the IRIS Center’s website or the GitHub repository.
Making a scrollytelling story
We’re using the Scrolly Story Generator, developed by Dan Schreiber for the IRIS Center. You’ll add content to your scrolly story using a Google Sheet. Your story will be broken into steps, and each step will include some text and a single piece of media. (Want to know more about setting up the scrolly story? Check out the GitHub page, where the code and documentation are stored. )
As you follow along, you can look at the links for the example spreadsheet and the example scrolly story.
1. Storyboard
Before you even start adding to the sheet, take some time to storyboard. What are the key pieces of media you want to highlight? Where does it make sense to break up your text? There’s some flexibility built into the tool (which we’ll talk about below), but a good rule is to try to keep your text under 100 words per step. (Less is fine!) This is a good opportunity to gather all your references in one place too.
Remember that your media items should be things you have permission to use: public domain, Creative Commons, or your own work. Check out this list of resources for free-to-use media.
2. Find your Google Sheet
Once you’ve got a good outline, head over to your Google Sheet. Each group has been given a link to their specific sheet. You can follow along with this example spreadsheet.
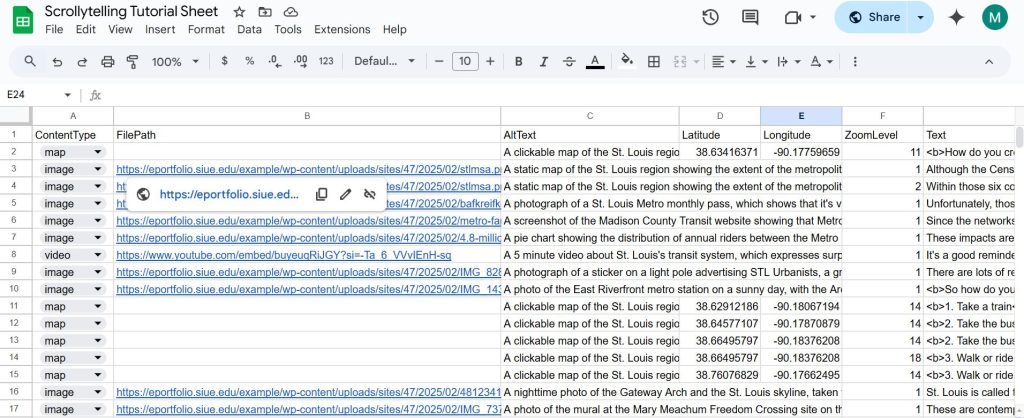
In the sheet, you’ll find two tabs: Story and Steps. Click over to Steps. (We’ll come back to Story later.)
3. Add steps
Each row in the spreadsheet is one step, and each step is a combination of one block of text and one piece of media. There are three types of step you can choose from, depending on your media type: map, image, and video, which all pair a text box with a media box, and text, which is just text that stretches across the whole page. Select your media in the ContentType column (Column A). For the next few columns, there are some small differences in the information you need depending on step type.
For maps:
- Skip Column B, the FilePath column.
- In Column C, the AltText column, describe what’s visible on your map and what purpose it’s serving in your narrative.
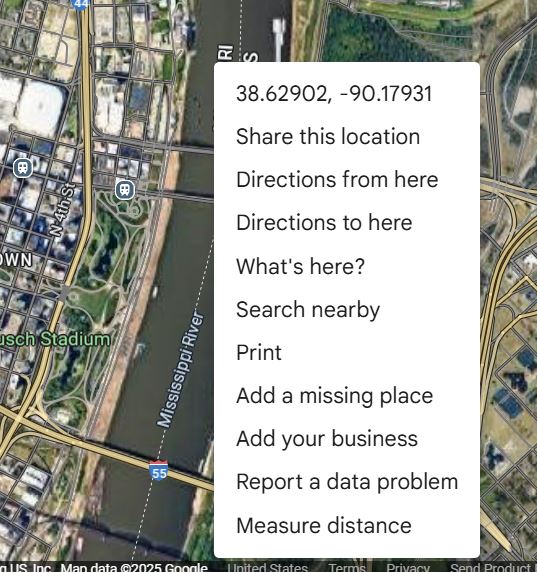
- In Columns D and E, Latitude and Longitude, add the coordinates for the center of your map. The easiest way to get your coordinates is to go to your location in Google Maps and right click/command+click on it. The coordinates will be at the top of the menu that appears. Click on them to copy them. Make sure that you separate the coordinates into the two columns and delete the comma between them — latitude is the first number, and longitude is the second number.
- In Column F, ZoomLevel, choose how far in you want to zoom on the map. Zoom levels range from 0 to 18, and the higher the number, the more zoomed in you’ll be. For maps, a zoom level of 4 or 5 will show a whole region of the country. A zoom level of 13 or 14 will show detail at the level of streets and buildings. You can set the zoom level for each step, so think carefully about what you’re trying to demonstrate and where you want your reader’s attention! At the bottom of this page, there’s a map where you can zoom in to the frame you want and see what the zoom level is.
For images:
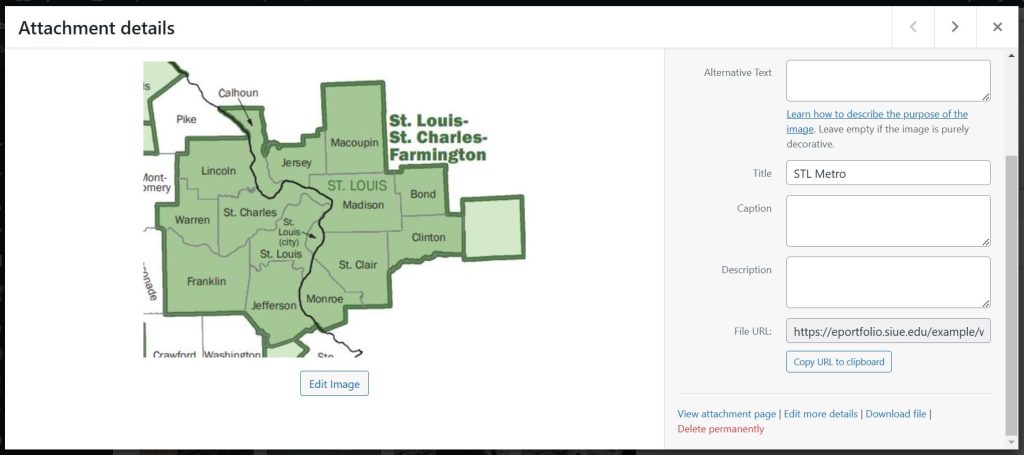
- To use images, you’ll need to link to them from somewhere. The best way to do this is to upload the image to your eportfolio. That ensures that you have a stable link that won’t break. Log into your eportfolio and head over to the Media tab in your dashboard. Once you’ve uploaded your media, copy the File URL.
- In Column B, FilePath, paste the File URL for your image.
- In Column C, AltText, describe your image and what purpose it’s serving in your narrative.
- Skip Columns D and E, Latitude and Longitude.
- In Column F, ZoomLevel, choose how far in you want to zoom on the image. Images don’t need as high a zoom level as maps, and your image will get grainy if you zoom in too far. Choose a zoom level of 1 if you just want it to display as is.
- The built-in zoom goes toward the center of the image. If you want to zoom in on a different area or pan between sections of the image, your best bet is to crop the image yourself and add the different areas of the image in as individual steps.
- Your images will take up a big chunk of the screen, so make sure you’ve got a relatively high-resolution image — ideally not less than 1200 px in either direction. Not sure how big your image is? If you’ve got it saved to your computer, right click and select Properties and go to the Details tab.
For videos:
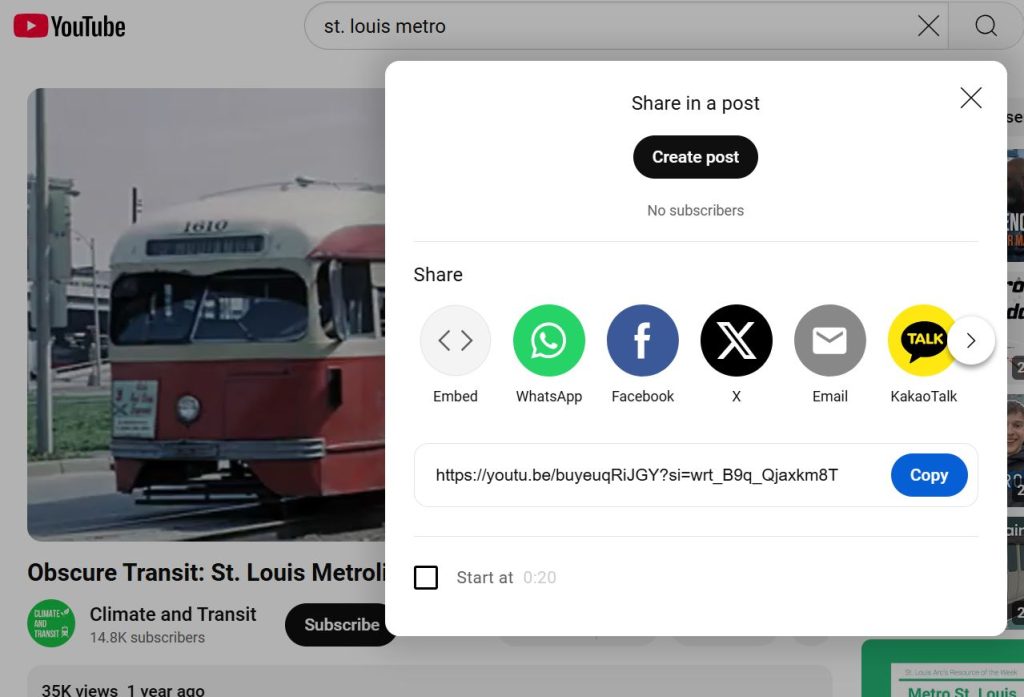
- You can upload videos to your eportfolio, but in some cases the file sizes might get too big. You can also use links from YouTube or Vimeo. If you do, you’ll need to copy the link out of the embed code. Click on Share > Embed, and then copy the URL in the code.
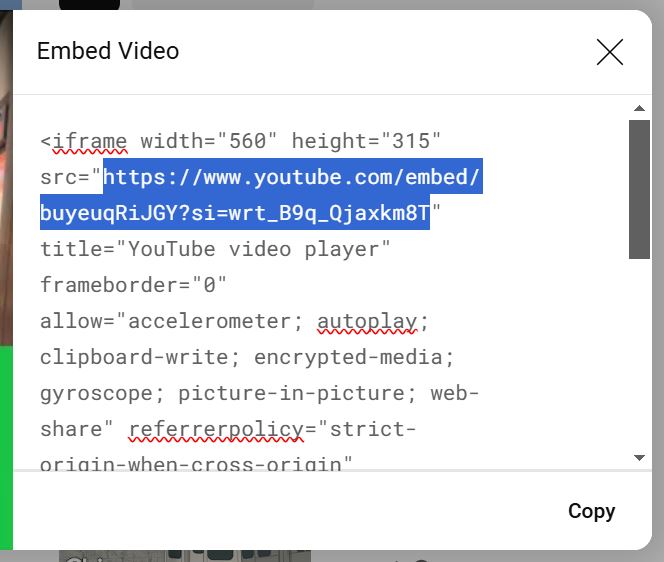
- In Column B, FilePath, paste the URL for your video.
- In Column C, AltText, describe your video and what purpose it’s serving in your narrative.
- Skip Columns D, E, and F, Latitude, Longitude, and ZoomLevel.
4. Adding text
Column G, Text, is the same for all media types. This is where you’ll add your narrative content to your story. You have two options here:
- You can add text to an existing piece of content, in which case the text will appear to the left of the media. If you go this route, try to keep your text under about 100 words per step.
- You can add text as a standalone box with no media, in which case your text will stretch across the whole width of the page. To do this, select “Text” as your content type and leave columns B through F blank. You can have longer chunks of text in this format.
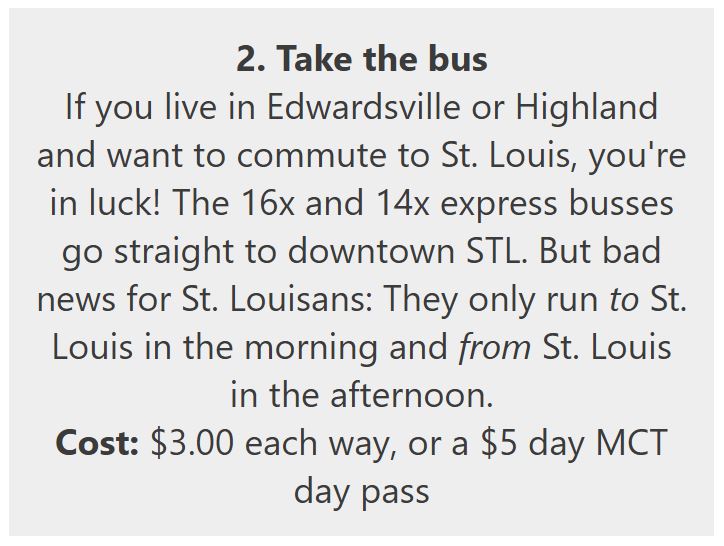
In both cases, you can format your text using HTML. Here are a few essentials.
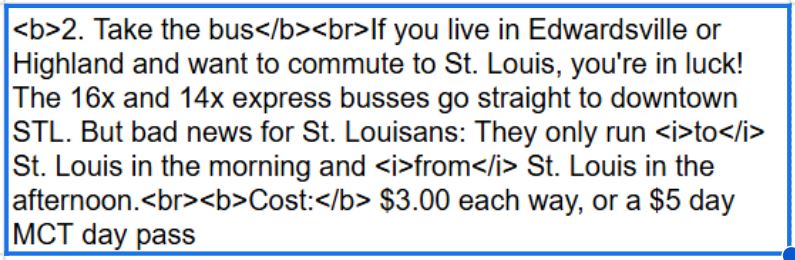
- Since you’re entering your text into a spreadsheet, you won’t be able to use the Enter key to separate your paragraphs. But no one wants to read a wall of text! In order to break your text, use two linebreak tags between your paragraphs: <br><br>
- You might want to format your text. Some handy formatting tags include <b>bold</b>, <i>italics</i>, and <u>underline</u>.
- You can also include links in your text: <a href=“www.example-url.com”>The text you want to show up on the page goes here</a>. This is one way to add references as you go!
- If you want to do more with HTML, check out this list of basic tags.
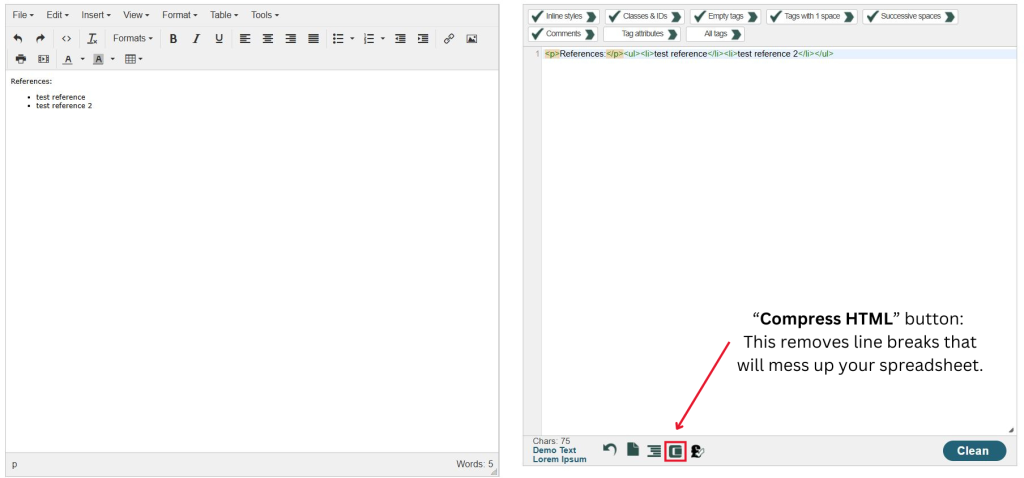
- You can use this HTML editor to format your text and generate the correct HTML. Format your content using the editor on the left side, and you’ll see your HTML appear on the right side. Before you copy it over, press the “Compress HTML” button at the bottom of the HTML window.
5. Finalizing your story
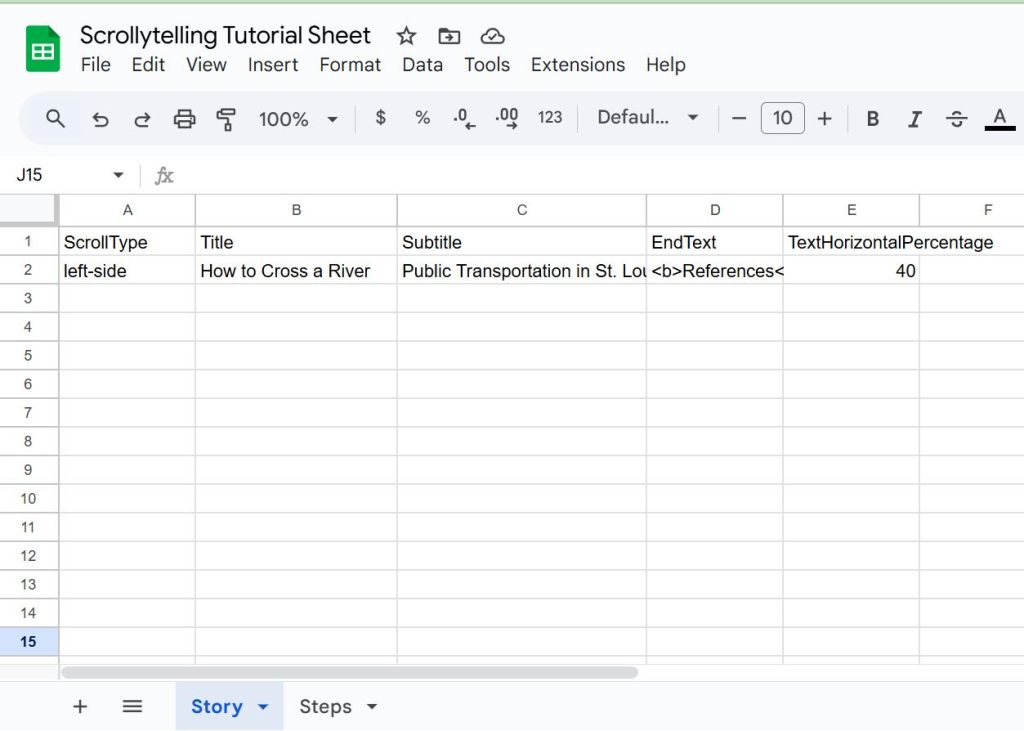
Now that you’ve got the story content finished, it’s time to add some finishing touches and edit your content. First, go to the Story tab in your spreadsheet.
- Ignore Column A, ScrollType.
- Fill out Columns B and C, Title and Subtitle. (You can also use subtitle as an author field and put your names.)
- Column D, EndText, is what appears at the end of your scrolly story. This is a good place to put your references — use that HTML editor to format them without driving yourself too nuts.
- Column E, TextHorizontalPercentage, lets you change how wide the text box is compared to the media box in your story. By default, it’s set to 33%, or 1/3 of the width of your screen. If you’ve got a lot of text-heavy steps, you might want to increase that to give yourself a little more room. I recommend staying under 50%.
- In Column F, Authors, put the author name(s).
Finally, go to your story’s link and read through it carefully.
- Proofread for any errors in your text.
- Make sure all your sources are cited.
- Take a close look at your media items: Are they displaying properly? Do they make sense? Are they high enough resolution?
6. Errors
Sometimes things get a little messy in the spreadsheet, and that generates errors with the tool. Most of the time, the tool will tell you what the problem is. Here are a couple common messages you might see and how to address them.
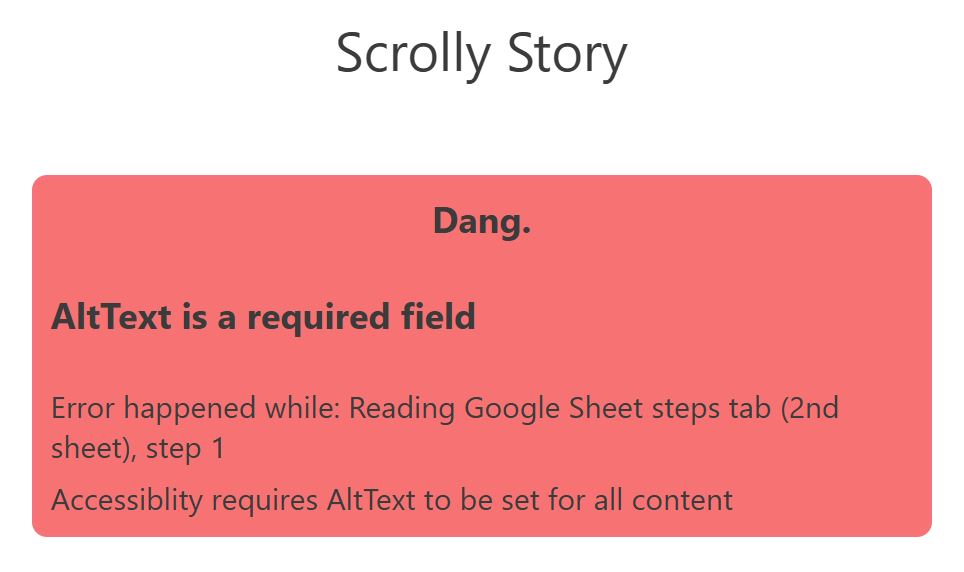
- AltText: AltText is a required field, because it helps make your stories more accessible. Your story won’t load if you don’t have alt text for each media item.
- Invalid contentType: Make sure your content type is one of the three drop-down options: map, image, or video.
Occasionally, the story might load, but a specific piece of media might not. Here are a couple ways to troubleshoot media errors:
- Maps: If your map box appears as an empty grey box, there’s probably a problem with your coordinates. Make sure that you don’t have a lingering comma in the latitude box.
- Videos: If your video has a little sad face icon, you probably have the wrong link in there. Make sure to copy the link out of the embed code, not the one from the browser or from the initial Share window.