The Overland Trails project, created by the Digital Scholarship Lab at the University of Richmond, is part of the American Panorama series. This interactive digital project visualizes the migration of thousands of emigrants along the Oregon, California, and Mormon Trails in the 1840s and 1850s. The project’s goal is to provide a detailed, data-driven exploration of westward expansion, using emigrant diaries and historical accounts to map the routes, hardships, and experiences of these pioneers. It is primarily intended for historians, educators, students, and history enthusiasts, offering a dynamic way to engage with migration patterns that shaped the nation. Through this work, researchers gained a deeper understanding of how geography, time, and human decisions interacted to define these historical migrations. The project uses interactive web mapping technologies, combining geospatial analysis, historical data, and digital storytelling. The Digital Scholarship Lab collaborated with Stamen Design, a firm specializing in data visualization, to create an engaging, user-friendly experience. The project likely took several months or years to complete, given its depth and digital complexity. A key strength of the project is its interactive design and rich historical integration, making complex migration patterns visually accessible. However, its weaknesses may include data interpretation challenges such as missing or biased historical records and technological accessibility for users unfamiliar with digital tools. While the Overland Trails primarily focus on western migration, they offer valuable context for regions like Edwardsville, Illinois, which played roles in migration routes and supply chains. The project enhances knowledge by adding depth to well-known historical narratives and reinforcing the scale and complexity of westward expansion. It is a valuable tool for understanding migration’s impact on American history, though some details might still require additional sources for a complete picture.
Category: Uncategorized (Page 9 of 17)
The data set on “Average Weekly Hours of All Employees: Total Private in St. Louis, MO-IL (MSA)” is curated by Trading Economics, a financial and economic data platform that compiles indicators from government sources. The primary source of this data is the U.S. Bureau of Labor Statistics (BLS) through its Current Employment Statistics (CES) program. The CES conducts surveys with businesses and government agencies to track employment, hours, and earnings trends.
The primary goal of this data set is to provide insights into labor market trends in the St. Louis metropolitan area. Policymakers, economists, and businesses use it to understand workforce dynamics, assess economic health, and inform decision-making. The data has been applied in economic reports, industry studies, and regional workforce analyses to evaluate economic growth and stability.
The data set is formatted as a time series, recording the average weekly hours worked by private-sector employees at regular intervals. This structure makes it easy to analyze trends over time, but the data set lacks details on industry-specific trends, demographic breakdowns, or distinctions between full-time and part-time employees.
The BLS applies rigorous data cleaning processes, including seasonal adjustments and validation methods. However, there are still potential sources of error, such as sampling limitations and revisions to initial data. The way Trading Economics presents the data could also introduce bias, as commercial platforms may highlight certain trends over others.
The data’s structure and intent influence how it can be used. Since it only tracks total private-sector employees, it may not capture sector-specific shifts or employment disparities within the workforce. A deeper analysis would require combining this data with other sources, such as wage trends or employment rates by industry.
This data set is useful for tracking labor trends, particularly for identifying economic expansions or contractions based on changes in work hours. However, its limitations require careful interpretation, ensuring that conclusions about the St. Louis labor market are contextualized within broader economic data.
Problem Statement: The Role of Music Venues that Shaped St. Louis’s Culture Identity.
Observation, Background, and Context: St. Louis is to be recognized as one of many central points for Music, specifically Jazz, Blues and rock. Some venues like the Pageant, Gaslight Square, and Blueberry Hill have provided performance spaces for iconic musicians while also giving and showcasing local talents. What inspired me to do this topic was I use to be in the band in middle school and played Saxaphone and clarinet. It’s interesting how these venues not only serve as entertainment for these musicians but also cultural spaces, which can mold the city’s identity and give the community a sense as well. As time continues with anything in life, there are economic shifts and gentrification that have affected these historic sites. Some thrive and expand while others have closed or shut down due not to meeting certain expectations. This brings me to the question as the impact of music venues on the city’s culture in the face of economic changes.
Problem at Hand: The challenge in understanding how music venues have impacted St. Louis cultural identity over time. What roles have these venues played in a social life of the city of St. Louis, and how they have molded to changing times? Another question to consider is how the impact of some places does be closed and not closed impact the local community, the musicians and the city’s landscape itself?
Technology to present this work: To do this research effectively, I will use an interactive storytelling map to visualize the changes in St. Louis’s music venues over time. By integrating these digital tools, I seek to get my audience attention and interact with the material while also having these informative resources that showcase the relationship between music, space and cultural identity.
I want to explore the timeline of when libraries were established and built in Madison County and perhaps the surrounding area. I grew up in an area that only had one local library, with the nearest Wisconsin branch being a thirty-minute drive away – and as a child there was no reciprocal borrowing between the branches (at least not in a way that was available to me). When I moved to the St. Louis, I was struck by the number of branches the library system had, though it was more of a necessity with a population as large as the St. Louis region. I never got a card when I lived in STL, so when I moved to Edwardsville I made a point to put my money where my mouth was and support local libraries. I was very surprised when I received my card and was told that my card was able to be used in most libraries in southern Illinois, so long as it was in good standing.
Having worked in libraries now for over five years I’m intimately familiar with the ways in which libraries are connected, and learned – at least in a vague way – the history of the libraries I have worked in. This last October Glen Carbon Centennial Library celebrated it’s twentieth anniversary from being built, and to celebrate the library went through many of its records and compiled a history of the library, and how it was established well before the physical building went up in 2004. I have previously explored the ways in which different library districts may not meet the needs of the population, as districts tend to leave gaps in coverage (Illinois Public Library Service Area Populations). In doing that geospatial project last semester, and in watching my library build its own history, it made me curious as to when and how different libraries in the region came to be – especially considering the politics of the time (e.g., Edwardsville’s library district was unwilling to allow another local library to join the consortium, as tax revenue from participating Glen Carbon residents would be routed away from the Edwardsville Public Library, making the library a contentious topic for the region).
Luckily, as many libraries are subject to Freedom of Information Act (FOIA) requirements surrounding transparency, most libraries have at least a partial history of their building on their website, or listed in their policy/procedure/personnel manuals. Glen Carbon Centennial Library, which of course would be included in my work, has its own webpage dedicated to the history of the library: Library History (glencarbonlibrary.org). In addition, there are some sources that can be found via news articles kept by the libraries in question, as well as histories provided by the Illinois Heartland Library System, specifically about how IHLS was implemented and when (illinoisheartland.org).
I think in terms of this project, it would make the most sense to use either an interactive timeline, such as KnightLab’s Timeline software, or StoryMap, since both would allow for a visual representation of when and how the locations were built. StoryMap specifically might be more visually appealing, but I’m unsure what data I will be able to find outside of date, place, and some basic surrounding information, such as how funding was sourced, so I think I’ll narrow down my focus as I move forward.
I chose to read through the documents from the drive folder, the 1862 and 1879 texts.
When skimming both documents, it seems as if they primarily focus on the agriculture, and description of the land, as well as the resources that St. Louis County had at the time. The 1879 text is very short, so I think most of the popular words will come from the 1862 text, and that it will be mostly based on the manufacturing, agriculture and business side of the city. On skimming, I see very little about the culture, so I don’t see much about that, and the text is very formal. I’m anticipating that there will be fewer positive or negative connotations associated with different terms throughout the text, simply due to the specific talk about the city and what it makes.
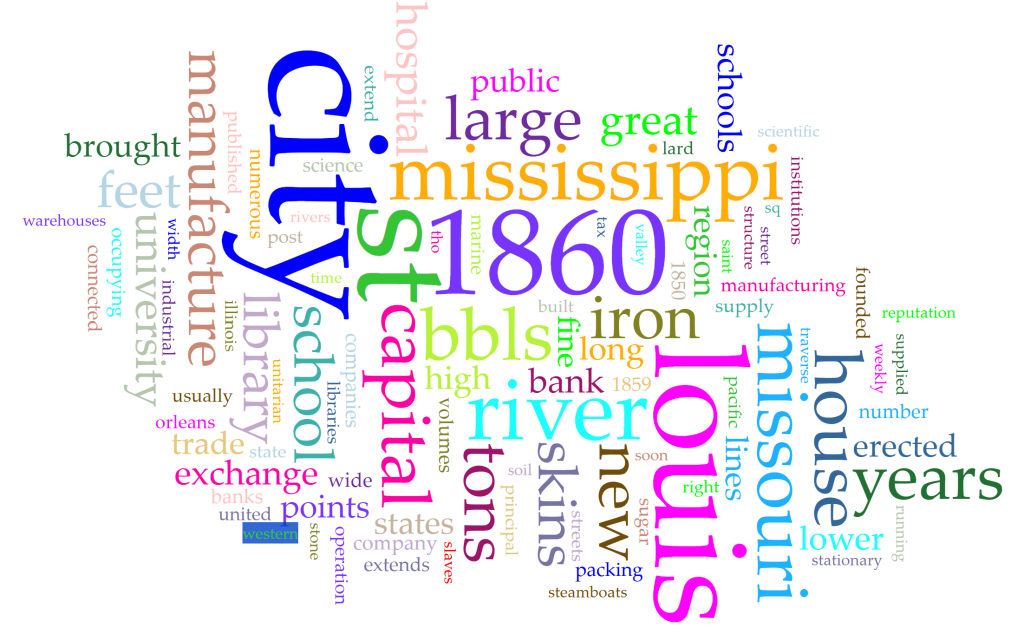
When I uploaded them into Voyant, I absolutely was correct that there would be a lot talking about the manufacturing and business side of the city. There was more information about schools, university, and other infrastructure outside of the supply chain than I expected, which does say something about the start of building a public infrastructure.
I was surprised by the number of positive words collated with different terms. When looking at “louis” as a term, it was often paired with terms like “charitable” and “magnificant.” Looking at other terms it is more positive as well, though there are negative connotations with the terms “slaves” and “limits.” I really thought that there would be much more neutral language surrounding the type of text being reviewed.
Since my major is nursing, I’ve decided to tackle the health disparities in St. Louis. The health disparities problems facing St. Louis are emphasized by two factors: division between the city and county and extreme racial segregation. St. Louis is one of the most segregated metropolitan areas in the United States. Racial and ethnic health inequities seem to be what we are currently facing in St. Louis County and the city of St. Louis. This includes equitable healthcare access, mental health disparities, heart disease, and cancer disparities. Social determinants play a key factor in the quality of healthcare. Health is affected by education, housing, access to health care, food security, and employment. This is highly important because it can have a significant impact on our daily lives. The questions that arise from my observations are, are there any adequate resources available that people may not be aware of, and if so how are healthcare providers, community organizations, and programs collaborating to reduce and promote these disparities? What interventions/tools are in place to address them.? To approach this, I would focus on engaging with the community, implementing accessible health programs, upholding policies, and ensuring funding is available. The method I intend to use in my project would be a distribution map or website. I also wouldn’t mind creating an organization to help others better understand its impacts on local individuals in the community.
Observation, background, context
I am drawn to this topic since I’ve always found the digital divide between race, age, and wealth to be very interesting. Most forms of technology feel simple to use, almost as an extension of my body, so when I see someone genuinely struggling to understand or use it, it’s interesting. Being aware of people’s lack of practice with a device, inability to use a piece of technology due to price, or technology being overly convoluted for someone to understand, is crucial to understanding the digital divide.
Problem
What causes the digital divide? My guess is the quarantine 4 years ago, as well as a person’s finance. As much as I’d like to say using technology is easy, if you didn’t grow up with it, it’s rather tricky. With technology becoming more and more ingrained into society, it’s especially important that the ability to understand the tools that are used in day to day life is common knowledge.
Frame
I am approaching this problem as someone who has experienced the divide firsthand. Not only am I the person my family calls when some technology needs fixing, I taught a group of senior citizens how to use various Microsoft products over last summer. What I learned from teaching is that people that don’t understand the technology are overwhelmed by the interface, so when there are no search options, the rate at which a person can work is substantially slower (considering they have to click through every option to find what they are looking for.)
Example sources
According to the “St. Louis Digital Divide Summary,” “Based on the five key components of the digital divide, it is apparent that income-related issues
such as service and device affordability are key drivers of the digital divide for most residents in St. Louis.” A person can’t begin to understand something they can’t use. The article, “Conquering the St. Louis Digital Divide: New Report Outlines Steps Necessary to Bridge the Gap” states that, “Exacerbated by poverty, the report found that nearly half of all households in St. Louis City and County are affected by at least one aspect of the digital divide.” Once again highlighting that large part of the issue seems to be the inability to afford technology.
Proposed technology
I intend to use charts and graphs to put a picture to the digital divide, and then use a roadmap of steps I believe would lead to a solution of the problem.
Sources
(https://stlgives.org/digital-divide-new-report/)
(https://stlgives.org/wp-content/uploads/2023/11/Digital-Divide-Summary-Report_22.pdf)
The two documents I chose to compare were Alton’s encyclopedia 1880 and 1906. My hypothesis is that the population would significantly increase from the mid-1850’s to early 1900’s. Hence some manufacturing developments were established in 1903, my hypothesis was correct. The population was approximately 12,000 in 1857. In the 1900’s the population in Alton had risen up to 14,210. The visualization I would use to test my hypothesis would be like a timeline graph.
Observation: Saint louis is a very vibrant city with a lot of culture and time killing activities, music, restaurants, site seeing, baseball games etc, but in 1904, perhaps the most grand event saint louis has ever been host to was the world fair, unveiling new technologies, food and culture the average person at the time almost certainly wasn’t privy to. Imagine never knowing what ice cream tasted like before that day, or how beautiful ancient japanese artwork is, or seeing the entire fair lit up with a fantastic brightness the likes of which you couldn’t imagine. X-rays, wireless phones, the automobile, I can only assume it felt like stepping into a brand new century.
Problem: with all of this wonder someone at that time would’ve assumed the rousing success of that fair would have happened many more times in the future, but it didn’t, the last world fair in the united states was held in 1984 in new orleans and what characterized as a “financial disaster” so in 1999 congress passed legislation that prohibited any future world fairs in the US. This event is meant to be a beautiful culmination of technologies and culture, allowing people to learn, take inspiration, and tear down the many barriers we place between what we know and what we don’t; yet such an event does not have political backing because of money, I believe this is a terrible shame, in today’s climate with everyone glued to screens and debates, I think a little “coming together” is warranted as the world is more divisive than ever.
Frame: My idea is for congress to repeal its prohibition of american hosted expositions so that maybe one day saint louis can host another world fair, scrounge up the money from our tax dollars, sell admissions, sell space for companies to show the technological advances they’ve made, live music, art exhibits, invite other cultures and countries and try to enact some of the values we should all hold paramount, unity, knowledge, progress.
Example: Dubai held a world fair called the 2020 expo in 2021. They have a website dedicated to the event, I can learn everything I need from there, from what I gather it was a massive year long event with almost every country participating.
Proposed technology, im thinking about using an interactive storyline, so that we can see the growth in particular industries or products after a world fair, like the debut of ice cream in saint louis and looking at the number of distributors selling ice cream in the aftermath of the fair. Or the new filtration system developed by john F Wixford to clean the water supply of saint louis specifically for the fair, and how we use the same basic technology today.
As a student in today’s world and modern lifestyle, public transportation can play a huge role in our lives. Public transportation is something quite a few people use to get from point A to point B. The St. Louis Metro system has been a transportation source for years. The metro is a source of transportation for many students and employers. The St. Louis Metro system is something that is heavily relied on among many people of different walks of life. This source of transportation can make us question the historical development and its effectiveness and also how it can better the future of the St. Louis metro systems.
To analyze the St. Louis Metro system from a broader perspective, we can focus on its historical growth, accessibility concerns, and how technology can help the future. Public transportation in St. Louis has continued to be able to adapt to change in recent developments and demographics. Therefore, when it comes to limited service and cutting services and value, there are some issues and concerns.
Technological advancements like data-based service planning, tracking apps for buses, and paying services allow people to have a smoother experience with the Metro system. Although there are some questions about advancement and how they will make things easier to access for the community.
Exploring issues like these can help us make use of historical records. Metro transportation usage shows trends and service over time. Studies have shown knowing the importance of social justice and also urban mobility can be considered as additional information. This will show a timeline of the historical system’s development and data. The studies provide an understanding of St. Louis metro bus systems and their urban challenges and question what kind of improvements are needed for the future for long-term benefit by using historical research which are also a questions in concern.