The two texts I chose were “Alton Encyclopedia 1906” and “STL Encyclopedia 1862”. My hypothesis was both documents would be very similar. My hypothesis is founded on both cities being in close proximity to each other in the same region and environment. Time was also a factor with the encyclopedia’s only being roughly forty years apart. My assumption would be not much would have changed in that timespan. The most common words appearing were city, louis, and river. This makes sense because the subject are two cities. Even though the Alton Encyclopedia is about Alton, its proximity to a larger city makes it very attached to St Louis. The same goes for the word river. With both cities being very close to a river, how both cities function will be directly related to the river.
Category: Uncategorized (Page 7 of 17)
One example of questions I guessed are question: Write a single HTML file that has a javascript program that uses a canvas2d to draw “hello” with individual lines and curves. Do not use fillText., answer: A webpage that reads hello (or HELLO or Hello). I answered it is likely to complete this task with .727. It was unable to complete the task meaning I was incorrect. After answering several questions beforehand, I noticed it was able to accomplish numerous different types of problems including probability, coding, etc. Therefore, I assumed it would be able to accomplish this task. From this experience, i learned the algorithm has its limits and capabilities.
Myrcale suber
3/27/2025 Macoupin Open Data
- Who made the project? ( The project is sponsored by the Illinois clean energy community foundation and conducted by western Illinois university’s Illinois institute for rural affairs ( llRA).
- What are the goals of the project? ( The Macoupin Count Open Data Portal serves as the hub of Macoupin’s efforts towards open government and transparency. it provides a wind array of information, including data on tax dollars , business locations genealogical records, wind monitoring floodplain studies and election results. )
- Who is the project’s intended audience(s)? ( Taxpayers, consumers, genealogists The intended audience for Macoupin County Open Portal is taxpayers, consumers, genealogists and anyone interested in accessing information about the county’s services, property transactions and wind date.).
- What are the project’s conclusions? In other words, what did the researchers learn after all their hard work? (to promote open government and transparency as well as to help people have a wind rang of information about how the county can apply there serves, as well as including information about the date on government services , county budgets, and election results. The goal the companies were making is being able to help the citizen find information much easier about were their tax dollars being spent.)
- employ? (so for this job title you have to have skills of being Data Analyst, It Specialists, Web Developers, Project Managers).
- How long did the project take from start to finish? (the project had two phrase before finish it in 2005 on September 1).
- What are the strengths and weaknesses of the project? ( Strengths- the data being easy accessible online , enabling users to search, or even a download. Weaknesses- a weaknesses privacy concerns : there is a risk of sensitive information being exposed, which requires careful management and security measures.)
- What specific methods and/or technologies does the project? ( Methods – Regular updates , data is updated often monthly to that the information remains current and accurate. Technologies- interactive charts and groups tools like Macoupin Budget.com and Macoupin Chartbook. Com use interactive visualizations to help users understand complex financial data.
- Reflect a little on what the project tells us about our local region. Does it enhance our knowledge with facts you didn’t know before? Does it add nuance or context to things you already knew? Does it gel with your understanding of the region? Does it seem off-base? ( Enhanced knowledge- the project access to a wide array of data, including government services country, budgets as well as election results, property transactions. Understanding – the transparency and accessibility of the data can reinforce what residents know about local governance and community services. The Accuracy- overall Macoupin county open data project appears to be a robust tool for enhancing local knowledge and providing detailed insight.
For this assignment I decided to cover the difference between the encyclopedia of St Louis in 1862 and 1879. The 1879 document is significantly shorter than the 1862, so I would assume the majority of key words will come from the longer 1862 document. I was surprised that the 1879 document which I looked over, seemed to cover mostly the numbers and economy of St Louis rather than any other aspects of the area. I would assume the longer document may dive deeper.
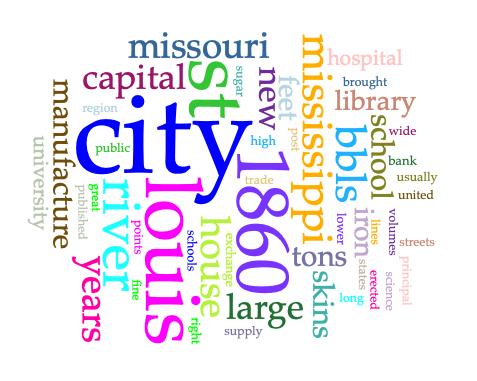
After inserting the longer document into Voyant, it shows that my hypothesis about what the contents may include was correct. While the shorter 1879 document focused a lot on the numbers of agriculture specifically. The longer 1862 document focuses on the entire infrastructure of St Louis, several areas such as schools ,libraries, and hospitals as shown in this visual. This was surprising to me as I figured that these infrastructures would have been more developed and further explored in the newest document, rather than early.
The Illinois land cover dataset from the early 1800s, credited to the Illinois Natural History Survey (INHS), uses historical land survey records like the Public Land Survey System (PLSS) to recreate the pre-settlement environment of Illinois. This data aids ecological restoration, historical comparison, and understanding landscape changes due to agriculture and urbanization. It is used by scientists, land managers, and educators for conservation and environmental planning. Formatted as GIS-compatible shapefiles or raster datasets, it maps and analyzes spatial patterns of historical land cover. The dataset includes geographic units such as township-range sections, dominant vegetation types, estimated extent, and surveyor notes. Although useful for spatial analysis, it may oversimplify local variations in land cover. Data cleaning involved resolving inconsistent terminology and correcting biases, but assumptions made during vegetation classification and boundary definitions introduced uncertainty. The creators’ focus on native vegetation enhances ecological accuracy while potentially excluding other perspectives. This dataset is valuable for environmental research but requires careful application to avoid misleading conclusions.
St. Louis has been an important center for public health innovation, especially in nursing. During research into the city’s medical history, the role of nursing in civil war healthcare and the 20th century became evident. Notably, there were Native American army hospitals, early public health campaigns, and the formation of nursing schools during segregation. These institutions illustrate the evolution of medical care and the cultural, racial, and technological dynamics that influenced the nursing profession in the region. The core question arising from this observation is: How has the development of nursing in St. Louis reflected broader cultural, racial, and social transformations in the region from the 19th century onward? This inquiry aims to understand how nurses—particularly women and people of color—managed professionalization, community care, and institutional power in a changing urban environment. This topic is approached from a historical-cultural perspective, considering both marginalized voices and institutional narratives. The viewpoint is guided by an interest in how local histories can challenge national ideas about healthcare progress and how nursing, as a gendered and racialized profession, has influenced and been influenced by the city’s development.
Primary Source: St. Louis Post-Dispatch, 1943 article: “Negro Nurses Graduate from Homer G. Phillips Hospital,” which documents one of the few institutions that trained Black nurses during segregation.
Secondary Source: D’Antonio, Patricia. American Nursing: A History of Knowledge, Authority, and the Meaning of Work (Johns Hopkins University Press, 2010). This book situates nursing within broader social and institutional structures, helping frame St. Louis within a national narrative.
StoryMapJS, an interactive storytelling tool, is proposed to visualize the evolution of nursing in St. Louis. The map will include key locations and institutions, such as Native American army hospitals, early Black nursing schools, and postwar medical centers, with archival photos, news clippings, and short narratives to explore how nursing evolved alongside regional social change. This format allows engagement with the historical development both spatially and narratively, showing how place, race, and care intersected in St. Louis’s past.
Spatial analysis is a method that uses mapping and geographic information systems (GIS) to analyze the relationships between people, places, and resources. Those relationships dictate what kind of access people have to things like grocery stores, banks, employment opportunities, green spaces, and more. Spatial analysis is a great tool for exploring concepts of spatial justice. In this lab, we’ll explore the spatial relationship between SIUE and the town of Edwardsville.
There are lots of tools we can use for spatial analysis. The most common one is ArcGIS, which is a proprietary (that is a paid) platform. We’ll be using a free tool. Those are sometimes less versatile (although you can do an awful lot with them!), but they also allow us to keep our data and our analysis regardless of whether we have access to a particular platform, and they’re often easier to use because they’re not as complex.
Understanding the Lay of the Land
- Go to https://mymaps.google.com and sign in. Hit the Create a New Map button.
- Navigate to Edwardsville. Using the push pin button, drop a pin onto the university and label it.
- Use the search bar to search for a particular kind of amenity – for instance, restaurants, grocery stores, or parks.
- Use the + button to add the results to your map.
- Make some observations: what does the distribution of those pins look like? Where are they clustered? Are they in proximity to the university? Are they distributed evenly throughout the area? Are they all grouped in one spot?
- Make sure you share your map with all group members before the end of class!
Thinking About Access
- Pick the closest pin to the university and grab its name or coordinates. Head over to Google Maps (the regular kind) and get the directions from the university to that place.
- Look at a few modes of transportation. How long would it take to drive there? Bike there? Take public transit there?
- What would it cost to get there? Think about gas, parking, transit fares, exertion, and other costs that might crop up.
- Now go back to your original map and look through the pins you added. Which one would you most like to go to? That is, which one would best serve your needs?
- Do the same thing for that location, mapping out directions and analyzing costs.
Reflecting on Resources
- What are the implications of your analysis? Is this an example of good access to resources, or are there challenges here? Is this an issue of spatial injustice?
- Reflect a little on your spatial analysis lab. What observations did you make? Have the things you noticed impacted how you experience SIUE and/or Edwardsville? How do you think they might impact others’ experiences, whether they’re students, faculty/staff, or community members? What do you think has caused the patterns you identified? If there’s an element of spatial injustice in what you observed, how might it be addressed?
For my final project I will be the covering the near 100 year history of Hollywood coming to St Louis to shoot films and television shows and the decline and hopeful rise of these productions coming to Missouri.
OBSERVATION: I am a Mass Communications major focusing in video production, this means I care a lot about how the film industry works and understanding the way it operates. I already had some history of films from the 40s-60s being filmed in St Louis. I was also remembered that Missouri recently passed an incentive involving tax breaks for productions to come here, to help promote more exposure and revenue for the state.
PROBLEM: I want to gain more context as to what caused the decline in productions in St Louis and the rest of Missouri, even when certain stories being told in film take place in the state. I also want to clarify through my research what is being done to promote productions to return to St Louis.
FRAME: I want to conduct research involving the specific timeline of when productions shifted from St Louis and Missouri to other locations. I will take myself through the history of film specifically taking place in the St Louis area and surrounding locations.
PROPOSED TECHNOLOGY: I have two specific pieces of technology in mind. I will be creating a visual timeline to better show the amount of time passed and each specific moment that I feel plays a part in answering my question. I will also use a guide map of North America specifically to show the vast locations that are popular for film productions, specifically in what they cost for a production to shoot there, as that plays a major part in why St Louis has not been involved heavily in any piece of Hollywood.
CANON R8 MIRRORLESS CAMERA
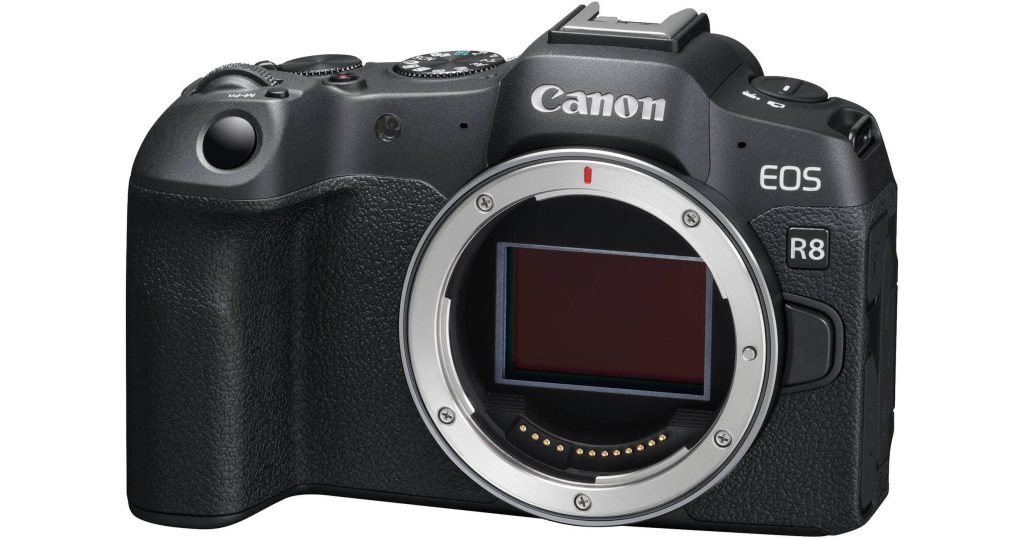
For my Meta Data lab I wanted to use my CanonR8 Mirrorless Camera, I have used a stock photo of the item so you would be able to see it in its most basic form. The camera was created and mass produced by Canon, a large Japanese based company that focuses on producing photo/video based devices along with other technological advancements. I bought this camera in December of 2024, however I bought it used and the camera was originally created a purchased in 2023. It is a digital still photography and video based camera. This camera shows the evolution of digital photography which has become even more digital. A mirrorless camera is the next step from a DSLR, literally removing the mirror from your camera, instead using a sensor to detect what is in front of the camera. Allowing it to be lighter and easier to carry around for long periods of time, it also allows for better video capabilities.
I major in Mass Communications with a focus in video production, and I plan on finding a career in the entertainment industry as a cinematographer working on film or television. I have recently started using this camera on a 30-minute short film I am shooting with a group of other Mass Comm students as a sort of passion project. I love film specifically, and being able to start learning more about the industry and get more used to the environment of it through working this camera has been a satisfying and exciting experience for me personally.
I’ve also included some footage I have recently shot with this camera (unedited), as part of the short film I discussed earlier, this is just a small snippet that we filmed recently.
Here is the visualization of my results from the forecasting challenge:
The top chart is based on my average Log-Loss, which according to the website is about a B average. The bottom shows how calibrated I am, specifically that I was a little overconfident in my answers.


I found this challenge very interesting, I am not a big user of Chat GPT, specifically when it comes to school work or asking it academic based questions, I will usually use it for cooking recipes most often.
I didn’t have much strategy other than staying kinda close to middle of the road either way, I was either around 35% or 75% on every question, other than some obvious ones like asking what the capital of France is. I was much more confident in the system to be able to do a lot of what the challenge asked it to do. However, I guess that is because I have never really had issues with it just based on getting recipes from it. Asking for ChatGPT to create large complex html files is much more complicated of course.