Category: Labs

Lab 4: GPT-4 Forecasting Challenge (2/17/25)

Today we’re revisiting the lab that got cancelled last Wednesday, and we’re keeping it simple: We’re going to do Nicholas Carlini’s GPT-4 Forecasting Challenge. Work through the prompts and rank what you think the probability is of ChatGPT correctly answering the given question.

When you’re done, post your results here with the tag “Forecasting” and write a couple sentences reflecting on how it went. Did the model do better or worse than you predicted? What was your strategy for prediction (50-50, or did you have assumptions about what kinds of tasks it would be better at?)?

TurtleStitch

I’m a big fan of just playing with software, especially when it’s not going to break my computer, so I just started clicking and dragging. It does look a lot like many block coding softwares, where you chain commands together, however I am only familiar with those from watching coworkers plan their youth coding courses (and generally I say something along the lines of “Couldn’t be me!” and go to plan my art programs). This was interesting, and made me question my math abilities, minimal as they already are. I couldn’t figure out the inner degree of a point on a five pointed star, as shown below (though I got awfully close with the 145 degree turn) and the final product was a star that overshot its margins by a little bit. Getting to this point, however, took me awhile, as I kept trying to get the turtle to rotate an inner degree amount instead of the outer degree amount – it felt backward to me, but made sense after I drew it out, and it took a while before I made anything other than a clunky circle.

I had it start going around more repeats, and I loved that it started bringing out another star inside with the stitch lines and negative space with the white grid. I like mandalas, and I often will use my iPad to make them when I feel burnt out creatively, so it was interesting I accidently made one that worked infinitely.

(I just had to make a star that started and ended correctly – would’ve bothered me forever).

I also would’ve liked to try making a different type of pointed star, but my math brain was tired, and I didn’t want to find more degrees to try.

SIUE’s CougarNet Page WAVE Accessibility

I reviewed the CougarNet login page, and found the following results:

  • What accessibility issues crop up for the page you chose?
    • There were a bunch of different problems that popped up, among them broken skip links, redundancy in text to speech, and low contrast errors.
  • Who is most likely to need the content on the page?
    • All SIUE students and faculty will use this page.
  • How might the accessibility issues impede people’s access to the content? Who might be most impacted?
    • This is something that could impede many students who require text to speech software in order to navigage the page. Behind all of the errors and reduncancies, the student needs to be able to find the login page, and access everything related to their academic career: grades, registration, student bills, financial aid, etcetera.
  • Name one or two ways that the accessibility of the site could be improved – the smaller and easier, the better!
    • There were a lot of low contrast errors, which could be solved by making images, logos or text higher contrast. This is something that shouldn’t be too difficult for the purposes of this page, as most images are fairly simple, anyways. In addition, there are suspicious alternative texts attributed to images and links that should be updated accurately.

Lab 3: Web Accessibility (1/27)

Web accessibility guidelines help us to ensure that our content meets at least a minimum threshold for accessibility. While it’s a long way off from universal design (designing to make sure our projects are maximally accessible for a maximal audience), it’s an important first step.

There are a variety of tools for evaluating accessibility. Tools like Funkify allow you to simulate various disabilities to get a sense of how design impacts usability. That’s useful to a point, although it’s always better (and necessary!) to talk to actual people whose lived experiences are a much better guide.

Today, we’ll use WAVE, the web accessibility evaluation tool.

  1. Choose a page on the SIUE website to evaluate, and run it through the checker at https://wave.webaim.org/.
  2. In a blog post (with the tag “Accessibility”), answer the following questions. Bullet points are fine!
    • What accessibility issues crop up for the page you chose?
    • Who is most likely to need the content on the page?
    • How might the accessibility issues impede people’s access to the content? Who might be most impacted?
    • Name one or two ways that the accessibility of the site could be improved – the smaller and easier, the better!

Introduction

Hello, I am Caden French, an aspiring Mechatronics and Robotics Engineer. One of my favorite hobbies is to read. I am a big fantasy enjoyer and I love most things written by Brandon Sanderson.

The following is a picture of the best potatoes that I have ever had and have been desperately trying to recreate, but failing hard at!

Some quick fun facts about me:

  • I enjoy board games, word games, and trivia.
  • I am good at geography, but don’t ask me about the flags!
  • I owned a couple chickens at one point.

I hope you enjoyed!

Zach’s Lab

  1. List of socials:

    Snapchat

    Instagram

    LinkedIn

    3) Snapchat, I use to keep up to date with my friends as another way of texting. For Instagram I use that to follow different places or local eatery places in Chicago and also to post things about my daily life as a 19-year-old college student. My LinkedIn social is used for connecting with students from SIUE and professional people who are in the same or similar field of work that I want to go into once I graduate. LinkedIn is also good for posting your accomplishments that you have gotten from school or work.

    4) As far as information I want people to know about me is that I am sophomore in college with a study of Public Relations with a minor in sociology. I am from Chicago; IL and I came to SIUE because I was awarded a scholarship that takes care of my tuition and the environment that the school is located in. I’m far enough away from home but not too far which I like. I am a very friendly person and approachable person as well.

    Maya O. (Lab 1- Introduction)

    Hi everyone, my name is Maya. This is my first year at SIUE as a transfer student. My major is Mass Communications with a concentration in Advertising and Strategic Media (minor still undecided at the moment). Some of my hobbies/ things I enjoy include: reading, collecting vinyl records, watching/keeping up with shows and movies (my favorite reality show is Survivor), and doing outdoor activities with my family (we’re all also pretty competitive when it comes to Nintendo Switch games). I have a cat named Luna who is an eight year old Korat (she’s pretty bossy but we love her anyway). I’m very much a homebody so I love being at home, but I would also love to eventually travel to Canada (specifically Prince Edward Island) and maybe later in life, the Cliffs of Moher in Ireland.

    Lab 12: Constructing a Biography of Place (4/7)

    Following our discussion of emplaced storytelling, today we’re creating a biography of place. This is an opportunity for you to think about the places and communities that you’re connected to and how they’ve shaped you. We’ll be using StoryMapJS.

    StoryMapJS is an easy-to-use tool for digital storytelling using spatial data. Through a simple web interface, users can create storytelling exhibits that move their audience through a series of points on the map, each including media, captions, and extended narrative. The resulting map can be embedded on almost any website.

    How does it work?

    For the audience, StoryMapJS is a bit like a PowerPoint, in that you click through slides, which might have a variety of content on them. That content is layered over a map, and as you move through the slides, you also move visually through space.

    For the creator, the experience is likewise very simple. You enter the editor with a google account, and you’re presented with a very intuitive editing interface. As you add each slide in the order they’ll appear, you have the opportunity to add a headline, body text, an image, image credit, and a caption. You can also customize the appearance. There are a variety of built-in base maps to choose from.

    The assignment

    An important note: Your stories are your own, and some might be more personal than you want to share here. You’re not required to include anything you’re uncomfortable sharing. There are any number of frames you can employ here – experiences that set you on your current major or career path, favorite spots to walk, even places you imagine visiting. You’re welcome to employ whatever frame you like and to think creatively about it.

    1. Come up with a list of 5 to 10 places that have been particularly influential for you. These can be any size – a city, a neighborhood, a park bench, or a room in your house. And they can be in anywhere – places you’ve lived, visited, where you are now at SIUE.
    2. Write a couple of sentences describing the place and your relationship to it. What does someone who’s never been there need to know to understand this place’s importance?
    3. Pick a picture that represents a feeling or a memory about each place and write a caption that explains the significance of the picture for someone who’s never been there. If you don’t own the picture, make sure you figure out who to credit as well.
    4. Head over to StoryMapJS and click the green “Make a StoryMap” button. It’ll prompt you to log in with a Google account. When it gives you your list of StoryMaps (probably empty), hit New to begin.
    5. Create your title slide. The first slide is your title slide, so it won’t have a location. Give it a headline and a brief description. You can also include an image here if you’d like
    6. Add a new slide using the + button on the left of the page. Use the search bar on the map to find the right location. You can drag the pin if you want to be more precise. Add your text and image here as well, and then repeat for the rest of your locations.
    7. Hit save (top menu).
    8. Once you’ve saved, go to Share in the top right. Scroll down until you see the embed code. It’ll start with <iframe … Copy the whole embed code and create a new blog post on the course website. Add a custom HTML block, and paste the embed code in.
    9. Publish your post with the tag “Storymap” and you’re good to go! If you don’t finish today, make sure you complete in by the start of our next class.
    Lab 2: Zotero for Digital Humanities Research (1/22)

    Zotero is a reference manager that allows you to store, annotate, and cite sources. It’s a deceptively powerful tool that can make writing a paper much easier if you use it from the outset! All of our course readings are stored in our class Zotero library. Everyone has their own system for how they keep up with readings and annotations, so you’re not required to use it every week. But this week, we’ll test out some of its features so that you know that it’s capable of. (If you don’t already have a system for taking notes while you read, I recommend trying Zotero out for a few weeks!)

    1. Create a Zotero account. Visit zotero.org and click “Log In,” then “Register for a free account” to create your username.
    2. Join the class group. Go to https://www.zotero.org/groups/5819541/hum230sp25 and click the red “Join” button.
    3. Annotate the syllabus. Find the class syllabus in our library. You’ve already read through it once, but go ahead and skim through it again. Is there anything that catches your eye? Leave an annotation on the document. Maybe it’s a tool or topic you’re interested in, or a question you have about a class policy, or even a typo you notice.

    Don’t forget, your homework for next week is to add to the library.

    Lab 1: WordPress and Writing for the Web (1/15)

    Crafting a Digital Identity

    1. Make a list of the social media platforms you’re active on.
    2. Who are you speaking to (or listening to) on each one? What communities are you participating in?
    3. What do you share about yourself on each platform? What do you keep private?
    4. Think about this class as a digital community of colleagues. What information do you want us to know about you?

    Write and post a blog post introducing yourself. Include an image – that might be of yourself, of your pet, of a place you love, etc. Add the tag “Introduction” before you hit publish.

    Adding A Blog Post to WordPress

    • Accessing the Dashboard: Our website is https://iris.siue.edu/hum230sp25. You can access the dashboard by going to https://iris.siue.edu/hum230sp25/wp-admin and logging in with your SIUE username and password.
      • Once you’re logged in, you’ll also see a banner at the top of the website that includes a link to the dashboard.
    • Adding a Post: When you’ve made it to the dashboard, click on “Add New” Under the “Posts” heading to the left of your screen. You’ll be taken to a screen that looks like a word processor. You can type right into the post box, or you cut and paste directly from your own word processor into the blog screen.
    • Adding a Title: Type a title in the “Add Title” Box that is informative and describes your topic.
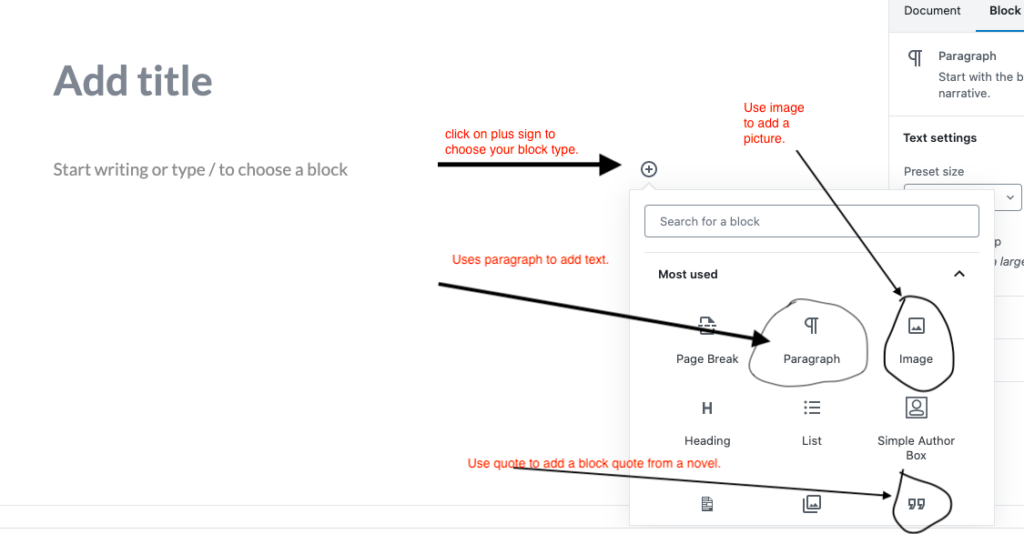
    • Adding a Block with Text or Media: Click on the plus sign to choose what kind of content block you are adding. Common blocks include “paragraph” to add text, “image” to add a picture, or “quotation” to add a block quote. There are several other block types you can add, but these three are the ones you’ll likely need most often.
    • Adding your post’s text: Add a paragraph block and then type your text. Note that a toolbar will pop up at the top of the screen giving you options for formatting the text.
    • Adding Image: Add an “Image” block. The site will give you the option to add an image from a URL, upload one from your computer, or choose one that has already been added to the media library.
    • Saving your Work: Click on “Save Draft” and then “Preview” in the widget in the upper-right hand corner to check your work (In “Improved” mode “save” and “preview” are at the left of the editor). Take your time, add to the post, and proofread.
    • Publishing: Choose “Publish” from the widget at the right for the post to appear on your blog (or at the left of the editor in the “improved” version).