Data Set Profile:
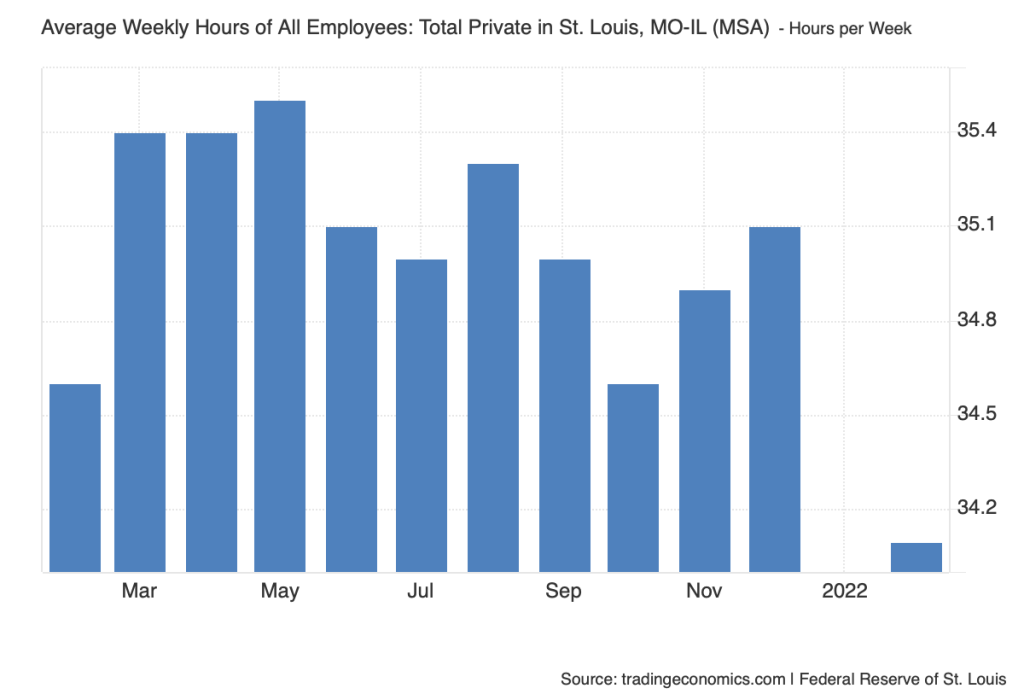
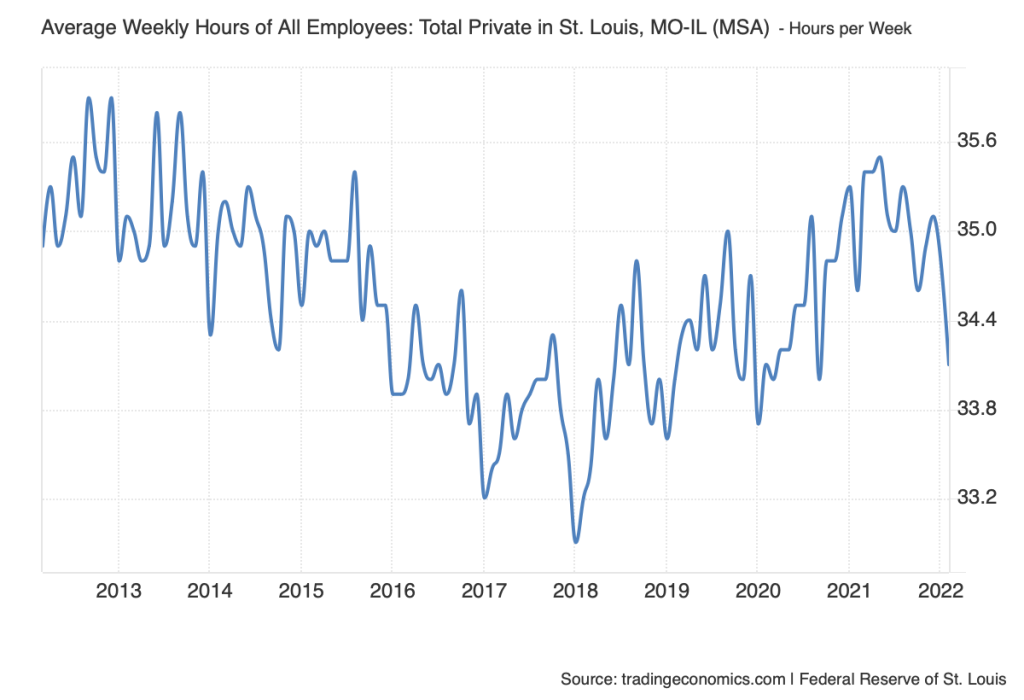
For my Data Set Review I decided to cover the average weekly hours of all employees in the STL, Metro area. Trading Economics is the only group credited with providing the data set. The primary source for this data is the United States Federal Reserve, it has been updated as recently as March of 2025. On Trading Economic’s about us page they mention wanting to provide consistent accurate economic data to people all around the world, this specific data set is just one of thousands they have created. It has been used for statistical analysis but specifically to find patterns or correlations to hours work per week based on timeline. Finally, the data is formatted in two different forms, for an individual year the average hours per week is shown as a bar graph, with a different data amount for each month. Then for a year the data is presented in a line graph.
Data Set Evaluation:
The Data set has been structured with a simple time frame to hours worked ratio. This allows for simple analyzation of the data presented, you can gather patterns easier and see a visual understanding of the increase/decrease of hours based on a per month time frame or per year. The creators do not specify their choices in gathering or cleaning up the data, rather presenting examples of why they may have created it, by showing the drastic difference between any time frame. Trading Economics advertises themselves as a website to find accurate data about all areas of the economy in any area in the world. They mention their constant fact checking of material, and use of only first hand sources, nothing third party. They also mention the site has been viewed and trusted by over 2 Billion people across the world. This makes me feel safe in trusting their sources and data that they present. I think it would be interesting to use this data to visualize the differences between work hours based on time of year or differences year to year. There is an interesting dip in hours in October of 2022 specifically in this data that interests me as to why that could be. There is also a clear dip in the entirety of the 2nd-4th quarters of 2020 for obvious reasons. But seeing it presented in this visual sense makes it much easier to see the sheer difference.